Biodistribution and Toxicological Effects of Ultra-Small Pt Nanoparticles Deposited on Au Nanorods (Au@Pt NRs) in Mice with Intravenous Injection
Introduction
Noble metal nanoparticles have high specific surface area and surface energy, which makes their surface atoms very active; therefore, they have superior properties in optics, electricity and catalysis.1 Up to date, noble metal nanoparticles have been intensively investigated in biomedical fields, such as biosensors, catalysts, detection and imaging.2–5 Among various noble metal nanostructures, gold (Au) and platinum (Pt) based nanostructures are the ones that attract wide research interests. It has been well documented that gold nanorods (Au NRs) have aspect ratio-associated longitudinal surface plasmon resonance (LSPR), showing great potentials for optical sensing, imaging, and thermotherapy.6,7 PtNPs have garnered a steadily growing interest in biomedical applications such as antimicrobial agents, anticancer agents, targeted drug delivery, hyperthermia, photoablation therapy, bioimaging, and biosensing.8,9
Bimetallic nanostructures are combinations of two different single metal nanostructure that might exhibit combined advantages, which are excellent potential candidates for sensors, catalysts, optical detectors, and biomedical applications.10–13 Due to the red-shifted LSPR and higher cell uptake capacity than Au NRs, [email protected] NRs have demonstrated stronger photothermal therapeutic effects at a longer wavelength than conventional Au NRs in the breast adenocarcinoma.14 [email protected] NRs are also highly desirable for catalysis because the tiny Pt nanodots distributed on the surface of the Au NRs have larger surface area.15 With synergistic excellent properties, core-shell bimetallic [email protected] nanostructure has been investigated in biomedical applications.16–18 For example, the porous [email protected] nanostructure was reported to relieve the oxidative stress damage and inhibited the tumor growth through chemo-photothermal co-therapy because of their high catalytic activity and unique optical properties.18
One of the most important issues in the biomedical applications for nanomaterials is the evaluation of toxicity and biocompatibility in vivo; however, studies of the toxicity of [email protected] NRs are not sufficient. There were only a few reports on the toxicity of [email protected] NRs in the cell lines (mainly on cancer cell line, like human breast adenocarcinoma cell MDA-MB-231,14 human leukemia cell K562,19 human bladder carcinoma cell EJ,20 etc.), but no literatures reported the toxicity of [email protected] NRs in vivo.
In this work, [email protected] NRs were synthesized and single dose was intravenously injected to healthy C57BL/6 mice. The biodistribution of [email protected] NRs was examined by atomic absorption spectroscopy (AAS) and transmission electron microscope (TEM). Tissues were stained with hematoxylin-eosin (HE) and observed by microscope, and the antioxidant enzyme activity was measured with catalase (CAT) assay kit. In addition, peripheral blood analysis and blood biochemical parameters were determined by blood cell analyzer. We showed that the intravenously injected [email protected] NRs are mainly distributed in the liver and spleen with comparable levels, which did not display significant toxic effects on the organs’ function within the tested term; meanwhile, [email protected] NRs were able to degrade, indicating an acceptable safety to the mice and application potentials in biomedical applications.
Materials and Methods
Materials
Sodium borohydride (NaBH4), chlorauric acid (HAuCl4), cetyltrimethylammonium bromide (CTAB), silver nitrate (AgNO3) L-ascorbic acid (AA), potassium tetrachloroplatinate (II) (K2PtCl4), poly (sodium-p-styrenesulfonate) (PSS) and sodium chloride (NaCl) were purchased from Alfa Aesar (Waltham, MA, USA). Paraformaldehyde and sulfuric acid (H2SO4) were obtained from Beijing Chemical Reagent Company (Beijing, China). Glutaraldehyde was purchased from Honeywell (Charlotte, NC, USA). All the chemicals above were of analytical reagent grade. Nitric acid and hydrochloric acid were guaranteed reagent grade and purchased from Shanghai Aladdin Biochemical Technology Co., Ltd. (Shanghai, China). Mouse fibroblast cell line (NIH3T3) was obtained from the Cell Center of Institute of Basic Medical Sciences, Chinese Academy of Medical Sciences & Peking Union Medical College (Beijing, China). Human umbilical vein endothelial cells (HUVEC), human hepatic sinusoidal endothelial cells (HHSEC) and endothelial cell medium (ECM) were purchased from ScienCell Research Laboratories (San Diego, CA, USA). Modified RPMI medium, high-glucose basal Dulbecco’s modified Eagle’s medium (DMEM) and PierceTM BCA protein assay kit were obtained from Thermo Fisher Scientific (Waltham, MA, USA). CAT assay kit was obtained from Nanjing Jiancheng Biology Engineering Institute (Nanjing, Jiangsu, China). Cell Counting Kit-8 (CCK-8) was purchased from Dojindo Molecular Technologies, Inc (Kumamoto, Kyushu, Japan). Five percent glucose was purchased from China Otsuka Pharmaceutical Co., Ltd (Tianjin, China), and saline was purchased from Guaranteed Pharmaceutical Co., Ltd (Shandong, China). Milli-Q water (ddH2O, 18 MΩ cm) was used for all solution preparation.
Preparation of [email protected] NRs
Au NRs were synthesized using a seed-mediated growth procedure as reported in previous literature (see the methods in the Supplementary Material).21 The obtained Au NRs were purified by centrifuging twice (12,000 rpm, 5 min). Au NR suspension (1 mL) was mixed with 75 μL of 2 mM PtCl42‐ aqueous solution. Then, 15 μL 0.1 M of AA was added and the total solution volume was diluted to 2 mL. The mixture was incubated in a 30 ℃ water bath for 1 h and centrifuged once (12,000 rpm, 10 min) after adding 1 mL of 0.1 M CTAB. The precipitate was dispersed in 0.5 mL PSS aqueous solution (2 mg/mL containing 6 mM NaCl), and the solution was incubated overnight. Finally, it was centrifuged once (12,000 rpm, 10 min) and redispersed in ddH2O.
Characterization of [email protected] NRs
The morphology of [email protected] NRs was characterized using a transmission electron microscope (TEM-1400 plus, JEOL Ltd., Tokyo, Japan). Dynamic light scattering (DLS) was conducted to measure the hydrodynamic diameter and zeta-potential of [email protected] NRs in ddH2O, 5% glucose, saline and modified RPMI medium using NanoBrook Omni (Brookhaven Instruments, NY, USA). The absorption spectra of the [email protected] NRs were detected by ultraviolet-visible-near-infrared (UV-vis-NIR) spectrophotometer (Lambda 950, Perkin Elmer, MA, USA).
Animals and [email protected] NRs Treatment
All animal experiments were approved by and performed in accordance with the guidelines for ethical review of animal welfare by the Animal Care and Use Committee of Institute of Basic Medical Sciences, Chinese Academy of Medical Sciences/Peking Union Medical College. Six-week-old female C57BL/6 mice were maintained in the Center for Experimental Animal Research under specific pathogen-free conditions. The mice were acclimated for one week in the animal center, then randomly grouped into four groups with the group of control, day 1, day 8 and day 16 (4 mice per group) according to the body weight. By mixing equal volume of [email protected] NRs in ddH2O and 10% glucose solution, [email protected] NRs in 5% glucose was prepared. Then, each mouse in the experimental group was injected with 100 μL [email protected] NRs suspension (consisted 6 mg/kg of Pt atom) intravenously, while the control group was injected with 5% glucose solution of the same volume. Mice were killed at day 1, day 8, and day 16 after injection of [email protected] NRs, while the mice in control group were killed at day 1. Tissues used for elemental content determination and enzyme activity were frozen at −80 ℃. Tissues used for transmission electron microscope and histochemical staining were preserved in 2.5% glutaraldehyde and 4% paraformaldehyde, respectively.
Determination of Gold and Platinum Contents in Tissues by Atomic Absorption Spectrophotometer
Organs including heart, liver, spleen, lung, kidney, brain, and bone marrow were frozen dried and weighed. The organs were digested on a hot plate with aqua regia (hydrochloric acid: nitric acid = 3:1, both electronic grades). The final sample solutions were diluted to 4 mL of 3% dilute acid. The Au and Pt contents in the organs were measured by a graphite furnace mode of atomic absorption spectrophotometer (ZA3000, HITACHI, Tokyo, Japan). The concentrations for the standard curves of Pt and Au were between 1 ~ 100 ppb and 1 ~ 50 ppb, respectively, with a good linear relationship (R2 > 0.99). The results were expressed as the element content per dry weight.
TEM Observation of Nanoparticle in Tissues
The liver, spleen and kidney were quickly extracted and immediately fixed into 2.5% glutaraldehyde at 4 ℃. The whole process took place on ice. The samples were successively dehydrated in ethanol and embedded into Epon. Ultrathin sections of tissues were cut, double-stained with uranyl acetate and lead citrate, and collected on copper mesh. Section was observed on TEM (TEM-1400 plus, JEOL Ltd., Tokyo, Japan). The energy-dispersive X-ray spectroscopy (EDS) mapping of [email protected] NRs was acquired by using a high-resolution TEM (Tecnai G2 F20 U-TWIN, FEI, OR, USA) at an acceleration voltage of 200 kV.
Histopathological Examination
Mice were sacrificed at Day 1, Day 8, and Day 16 after injection. The liver, spleen, kidney and lung were isolated and fixed in 4% paraformaldehyde immediately. After that, tissues were embedded in paraffin, sliced, stained with HE, and the slices were observed with an optical microscope (Olympus, Tokyo, Japan).
Biochemical Serum Parameters and Hematology Measurements
Blood was collected by eyeball extraction, and 10 μL of whole blood was placed in an EDTA-coated tube. The red blood cells (RBC), platelets (PLT), and white blood cells (WBC) were counted using a whole blood cell analyzer (Mindray, BC-5120, Shenzhen, China). The remaining blood (without anticoagulant) was kept at 4 ℃ for 2 h. After centrifugation (3000 rpm for 15 min), the upper serum was taken and measured by a biochemical automatic analyzer (Beckman Coulter, Au5800, USA). Serum alanine aminotransferase (ALT), aspartate aminotransferase (AST), alkaline phosphatase (ALP), total bilirubin (TBIL), total protein (TB), and albumin (ALB) are used to assess liver function. Renal toxicity was determined by urea nitrogen (BUN), creatinine (Cr), uric acid (UA) and cystatin C (CysC).
Measurement of Oxidative Stress Makers
The levels of CAT in tissues were determined using CAT assay kit. The protein contents were determined using PierceTM BCA protein assay kit. All groups had three replicate wells.
Cell Viability Assay
NIH3T3 was cultured in DMEM medium. HUVEC and HHSEC were all cultured in ECM medium. The cells were seeded into 96-well cell culture plates at a density of 4 × 10⁴ cells/well and incubated with different concentrations of [email protected] NRs at 37 ℃ for 24 h. Then, the cells were incubated with fresh medium containing 10 µL of Cell Counting Kit-8 for 2 h. The absorbance of the medium was measured at 450/630 nm using the Epoch Multimode Reader (BioTek, VT, USA).
Statistical Analysis
All the quantitative data were expressed as mean ± standard deviation (mean ± SD). One way ANOVA was used to assess the statistical significance of experimental results. Statistical analysis was performed using the SPSS software (SPSS 20.0).
Results
Characteristics of [email protected] NRs
The core-shell [email protected] NRs were prepared based on AuNRs, and the structural diagram of [email protected] NRs is shown in Figure 1A. The aqueous solutions with different concentrations of [email protected] NRs showed homogeneous black (Figure 1B). There were numerous small Pt nanoparticles distributing on the surface of the AuNRs (Figure 1C), and the [email protected] NRs displayed characteristic UV-vis-NIR spectra, in which the LSPR of [email protected] NRs was located at 767 nm (Figure 1D).
The particle size and zeta potential of [email protected] NRs in ddH2O, 5% of glucose, saline, and cell culture medium were measured by DLS (Figure 1E and Figure S1). Results showed that the particle size in saline and cell culture medium changed largely, while the size in ddH2O and 5% glucose changed slightly after co-incubated for up to 48 h. We would suggest that the ionic strength of the solutions could affect the measurement of particle size,22 and as for the nanoparticles encountered with the cell culture medium, the proteins in the medium could adsorb to the surface of [email protected] NRs,23,24 which would lead to the apparent difference in the particle size. Because CTAB used in the syntheses of Au NRs is of toxicity, PSS was assembled on the CTAB layer by electrostatic adsorption to increase the biocompatibility, which made [email protected] NRs negatively charged. The zeta potentials of [email protected] NRs in ddH2O and 5% glucose were −(39.27 ± 2.91) mV and −(36.60 ± 2.11) mV, and that after kept in the medium for 48 h, they changed to −(38.11 ± 0.26) mV and −(57.72 ± 0.46) mV, respectively (Figure S1).
Biodistribution of Au and Pt in vivo
To investigate the distribution of [email protected] NRs in vivo, 6-week healthy C57BL/6 mice were employed and injected with [email protected] NRs (6 mg/kg of Pt atom) in 5% glucose intravenously. As shown in Figure S2, no decrease on the weight of the mice was observed at each testing point in reference to that of pre-dosing. In addition, we did not observe any changes on the hydration state, locomotor activity, and behavior of mice in the process of experiment. The mice were sacrificed at Day 1, Day 8 and Day 16 post injection, and the levels of Au and Pt in tissue were determined by AAS. The control group was given an equal volume of 5% glucose and sacrificed at Day 1. It could also be noted that the sums of Au and Pt in all the organs decreased within the observation period (Figure S3), Figure 2 summarizes the content of Pt and Au in the organs. It was shown that one day after injection, the levels of Pt and Au in different organs varied. Ranking from high to low: spleen, liver, lung, kidney, heart, bone marrow, and brain for Pt, and spleen, liver, lung, heart, kidney, bone marrow, and brain for Au. The highest amounts were detected in the spleen and liver, with 207.62 μg/g and 23.97 μg/g of Pt and 179.59 μg/g and 9.14 μg/g of Au, respectively. Nevertheless, on the Day 16, the concentration of Pt in the spleen and liver was decreased 84.4% and 43.8% compared with that of Day 1, at the same time, the accumulation of Pt in the lung, heart, kidney, bone marrow and brain were significantly increased 34.6%, 87.2%, 88.7%, 141.4% and 327.7%, indicating that [email protected] NRs were redistributed over time. Considering the size of the organs, we calculated the absolute element content of Pt or Au in the tissue based on the organs’ weight and analyzed the distribution of the element content in each organ after one injection. It was shown that the level of Pt and Au was almost similar in the spleen and liver (Figure 3), though the weight of the liver and spleen varies greatly.
 |
Figure 2 Concentrations of Pt and Au in the different organs (ng/g dry tissue). (A) Spleen. (B) Liver. (C) Lung. (D) Heart. (E) Kidney. (F) Bone marrow. (G) Brain. Inserted plots were the amplification with optimal ranges of Y axis. Each data represents the mean ± SD (n = 4). *Represents the significant difference compared with the control. *: 0.01<p<0.05, **: 0.001<p<0.01, ***: p<0.001. |
 |
Figure 3 The distribution of (A) Pt and (B) Au in different tissue after one injection (ng). Each data represents the mean ± SD (n = 4). *Represents the significant difference compared with the control. *: 0.01<p<0.05, **: 0.001<p<0.01, ***: p<0.001. |
Correspondingly, EDS mapping in organs showed that the shape of some AuNRs had changed to irregular and fractured nanoparticles (yellow arrow) from cylindrical before the injection (Figure 4), suggesting that [email protected] NRs had experienced corrosion and Pt had been released from the nanorods in vivo. The original ratio of Pt to Au in [email protected] NRs was 0.3 that was changed over time in organs, and the ratio increased significantly in all the organs on Day 16 (Figure S4A), showing the Pt was easier than Au to accumulate in the organs. The changes of Pt/Au ratio in the organs at Day 16 were different that might result from the difference of releasing and accumulation behaviors of Pt in various organs (Figure S4B).
 |
Figure 4 EDS mapping images. (A) [email protected] NRs for injection. Scale bar is 20 nm. (B) [email protected] NRs in spleen and liver at Day 16 after a single i.v. injection. The yellow arrow pointed to AuNRs that had been irregularly broken. Scale bar is 50 nm. |
Histopathological Analysis
The toxic effects of single exposure of [email protected] NRs on the liver, kidney, spleen and lung tissues were investigated by HE staining (Figure 5). In the liver of mice treated with [email protected] NRs, it was seen that inflammatory cell infiltration (blue arrow) increased significantly, most of which were concentrated around the hepatic vein at Day 1 post injection. Without obvious pathological changes, the glomerulus in the kidney was infiltrated by neutrophils (green arrow), and the infiltrating inflammatory cells gradually decreased over time. In the spleen and lung tissues, there were no significant pathological changes observed after the treatment of [email protected] NRs.
 |
Figure 5 Histopathological sections of liver, kidney, spleen and lung with HE staining. The samples were collected at different time (Day 1, Day 8 and Day 16) after the [email protected] NRs injection. The blue and green arrows showed the infiltrating inflammatory cells in liver and kidney. |
Localization of [email protected] NRs Observed with Transmission Electron Microscopy
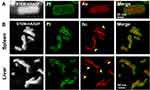
The localization of [email protected] NRs was examined by TEM at Day 1, Day 8 and Day 16 after treatment. [email protected] NRs were observed in phagocytic cells of the liver (Kupffer cells) and spleen (macrophages) and not detected in other cells such as hepatocytes, lymphocytes, and spleen red blood cells (Figure 6). Furthermore, [email protected] NRs are mainly scattered in the lysosomes of the cells in the liver and spleen while hardly observed in the kidney. Compared with the control group, a large amount of protein-like substances (shown with blue dotted lines in Figure 6) appeared in the glomerular capillary lumen of kidney on Day 1 after injection, suggesting an acute inflammatory reaction in the kidney, which was consistent with the results obtained from HE staining.
 |
Figure 6 TEM images of tissues (liver, spleen, and kidney) treated with 6 mg/kg [email protected] NRs or 5% glucose (control group) after intravenous injections. Columns 2, 4 and 6 were local magnified images of green rectangle in Columns 1, 3 and 5, respectively. The blue dotted circle showed the protein-like substances. |
Effects of [email protected] NRs on Oxidative Stress
The effects of [email protected] NRs on the oxidative stress in the liver, spleen and kidney of mice were studied by assessing the activity of endogenous antioxidant enzyme CAT. It was shown that [email protected] NRs significantly decreased the CAT activity in the liver, spleen and kidney after one day of intravenous injection (Figure 7), while there were no statistical differences both at Day 8 and Day 16 groups compared with the control group. These results indicated that intravenously injected [email protected] NRs could interrupt the redox balance in the liver, spleen and kidney in a short term, and then return to normal.
 |
Figure 7 The activity of CAT at different time after intravenous injection of [email protected] NRs. (A) Liver. (B) Spleen. (C) Kidney. The value represents the mean ± SD (n = 4). *Represents the significant difference compared with control. *: 0.01<p<0.05. |
Effects of [email protected] NRs on the Blood Cell Count and Blood Biochemical Parameters
To quantitatively evaluate the blood toxicity of [email protected] NRs, peripheral blood cell counts were measured. It was shown that [email protected] NRs could promote erythrocytosis, and that the number of RBC on Day 8 and Day 16 significantly increased compared with that of control group (Figure 8). The WBC increased significantly on Day 1 after injection and gradually returned to normal level. There were no obvious effects on the PLT. Taken together, there was no major hematological variation induced by the intravenously injected [email protected] NRs, except for the increase of WBC at the initial exposure. In addition, all hematological parameters were found to be within normal range for female C57BL/6 mice, denoted by the highlighted (light grey) region of each graph.25
 |
Figure 8 Blood count measurements at Day 1, Day 8 and Day 16 upon intravenous injection. (A) RBC. (B) WBC. (C) PLT. The data represents the mean ± SD (n = 4); *Represents the significant difference compared with control. *: 0.01<p<0.05, **: 0.001<p<0.01. |
Blood biochemical analysis was an important indicator of impaired organ function. To investigate the effects of [email protected] NRs on the liver and kidney, the function parameters of liver (ALT, AST, ALP, TBIL, TP, and ALB) and kidney (Urea, Cr, UA and CysC) were examined. Among the parameters for liver function, only ALT on Day 16 had small differences compared with control (Table 1), which was still within the normal reference range.25,26 There were no significant changes in all the test parameters for kidney function (Table 2).
 |
Table 1 Changes of Biochemical Parameters in Liver Function |
 |
Table 2 Changes of Biochemical Parameters in Kidney Function |
Cytotoxicity of [email protected] NRs in vitro
The cell viability of HUVEC, HHSEC and NIH3T3 were investigated with various concentrations of [email protected] NRs ranging from 0 to 6 μg/mL (Pt element concentration). As shown in Figure 9, the viability of the cells after treated with [email protected] NRs for 24 h was no less than 80%. NIH3T3 is an immortalized mouse embryonic fibroblast cell line,27 while HUVEC and HHSEC are human primary endothelial cells. It could be noticed that the cell viabilities of HUVEC and HHSEC were significantly decreased in a dose-dependent manner, while the viability of the NIH3T3 was not affected significantly by [email protected] NRs, this is possibly due to the different sensitivities of the two cells.28,29
 |
Figure 9 Cell viability of HUVEC, HHSEC and NIH3T3 co-incubated with [email protected] NRs for 24 h. The data represents the mean ± SD (n = 4); *Represents the significant difference compared with control. *: 0.01<p<0.05, **: 0.001<p<0.01, ***p<0.001. |
Discussion
Pt-based nanoparticles are widely investigated in biomedical fields due to their excellent catalytic and multiply-enzyme properties. However, the toxicity and biodistribution are not adequately understood yet. In this study, [email protected] NRs were synthesized and investigated in mice for 16 days after a single dose intravenous exposure.
It has been documented that [email protected] NRs are a kind of stable nanostructure. A research group reported that no obvious Pt release was detected from the [email protected] NRs surface determined by inductively coupled plasma mass spectrometry (ICP-MS).14 Our results showed that [email protected] NRs in 5% glucose were stable as that in the ddH2O, and another research group reported no obvious change detected with the dynamic diameter, zeta potential, and specific spectrum in various pHs and temperature for [email protected] NRs in ddH2O.30 These features allow [email protected] NRs to be applied as a whole nanostructure. Therefore, [email protected] NRs in 5% glucose was employed in the present work, not only to maintain the osmotic pressure but also to keep the dispersion stable for the intravenous injection.
Our results indicated that the liver and spleen were the primary site for [email protected] NRs accumulation possibly due to the rich phagocytes (eg, Kupffer cells in the liver and macrophages in the spleen), which were responsible for non-specific clearance of nanoparticles.31 On Day 16, the levels of [email protected] NRs in the liver and spleen were decreased and redistributed to other organs over time. It could be noticed that [email protected] NRs largely accumulated in the spleen, the level was comparable to that in the liver, and this feature might be valuable for developing therapeutics targeting spleen. Other researchers’ work also reported that notable metal nanoparticles prefer to accumulate in the spleen of mice.32–34
Notably, Pt could be detected in the brain though the concentration was low, which was higher than Au element, suggesting that Pt-based drug was easier to accumulate in brain than Au element. This could provide a hint for Pt-based drug in treating central system diseases.
The sums of Au and Pt in all the organs decreased within the observation period, which were mainly attributed to the significant decrease of the two metals in the spleen and liver. The decrease in the liver implied the excretion from faeces, while the decrease in the spleen meant that Au and Pt were able to enter the blood circulation and distribute in the kidney, lung, and heart, and even in the brain. Although the level of Au was reduced in all the organs, there was an increase of Pt in the kidney, bone marrow, lung, brain, and heart on the day 16, which suggested the excretion of Pt from kidney might be slower than that of Au, and the accumulation of Pt in the lungs may be attributed to the uptake of alveolar macrophages in the pulmonary circulation, and it might be cleared from the lungs to the gut and excreted by airway cilia.35 As additional data on fecal versus urinary excretion were not obtained in this work, it could not directly show the fate of the rest of the [email protected] NRs in the body and out of the body, which was a limitation of this investigation.
After being ingested, nanomaterials can directly interact with biological systems to induce oxidative stress. Oxidative stress was the result of an imbalance between the body’s antioxidant defense system and reactive oxygen species (ROS), which was thought to be harmful to cell membranes and DNA.36 The production of ROS was an attractive mechanism for NP-induced adverse reactions.37 The change of antioxidant enzymes was associated with the production of oxygen-free radicals.38 As shown in our results, the CAT activity decreased at Day 1. Owing to the extremely small particle size, nanoparticles might be retained in organs and induced further toxicity.34,39 However, in our study, only the aggregation of nanoparticles was observed to lead to slight infiltration of inflammatory cells, which had no effect on the structure and function of the main organs, indicating that [email protected] NRs have good biocompatibility.
Although this study revealed important information on the in vivo distribution and toxic effects of the promising nanomaterial [email protected] NRs, detailed pharmacokinetic studies can be further carried out in subsequent studies to examine the fate of [email protected] NRs in biological systems for a comprehensive risk assessment of [email protected] NRs.
Conclusion
In conclusion, the biodistribution and toxicological effects of [email protected] NRs in mice with intravenous injection were studied. [email protected] NRs could be largely distributed in the liver and spleen, while located in the lung and brain at the lower levels. In the physiological environments, [email protected] NRs experienced corrosion and Au released faster than Pt. [email protected] NRs did not show long-term toxic effects in vivo though induced mild short-term inflammatory responses. These results suggested that [email protected] NRs could be a safe candidate for uses of diagnosis and therapeutics.
Data Sharing Statement
The datasets used and/or analysed during the current study are available from the corresponding author on reasonable request.
Ethics Approval and Informed Consent
All animal experiments were approved by and performed in accordance with the guidelines for ethical review of animal welfare by the Animal Care and Use Committee of Institute of Basic Medical Sciences, Chinese Academy of Medical Sciences/Peking Union Medical College (ACUC-A01-2019-023). C57BL/6 mice were maintained in the Center for Experimental Animal Research under specific pathogen-free conditions. The mice were fed with sterilized food and autoclaved tap water.
Acknowledgments
The authors thank Prof. Qian Xie (Peking University Third Hospital) for her help in the detection of the biochemical parameters.
Funding
The work was supported by the National Key R&D Program of China (2017YFA0205504) and the National Natural Science Foundation of China (81801771).
Disclosure
The authors declare that they have no competing interests.
References
1. Iqbal M, Bando Y, Sun Z, et al. In search of excellence: convex versus concave noble metal nanostructures for electrocatalytic applications. Adv Mater. 2021;33(13):e2004554. doi:10.1002/adma.202004554
2. Ando J, Yano TA, Fujita K, Kawata S. Metal nanoparticles for nano-imaging and nano-analysis. Phys Chem Chem Phys. 2013;15(33):13713–13722. doi:10.1039/c3cp51806j
3. Ndaya CC, Javahiraly N, Brioude A. Recent advances in palladium nanoparticles-based hydrogen sensors for leak detection. Sensors. 2019;19(20):4478. doi:10.3390/s19204478
4. Zhang L, Zhou M, Wang A, Zhang T. Selective hydrogenation over supported metal catalysts: from nanoparticles to single atoms. Chem Rev. 2020;120(2):683–733. doi:10.1021/acs.chemrev.9b00230
5. Žukovskaja O, Agafilushkina S, Sivakov V, et al. Rapid detection of the bacterial biomarker pyocyanin in artificial sputum using a SERS-active silicon nanowire matrix covered by bimetallic noble metal nanoparticles. Talanta. 2019;202:171–177. doi:10.1016/j.talanta.2019.04.047
6. Manohar S, Ungureanu C, Van Leeuwen TG. Gold nanorods as molecular contrast agents in photoacoustic imaging: the promises and the caveats. Contrast Media Mol Imaging. 2011;6(5):389–400. doi:10.1002/cmmi.454
7. Zhang Z, Wang J, Chen C. Gold nanorods based platforms for light-mediated theranostics. Theranostics. 2013;3(3):223–238. doi:10.7150/thno.5409
8. Abed A, Derakhshan M, Karimi M, et al. Platinum nanoparticles in biomedicine: preparation, anti-cancer activity, and drug delivery vehicles. Front Pharmacol. 2022;13:797804. doi:10.3389/fphar.2022.797804
9. Jeyaraj M, Gurunathan S, Qasim M, Kang MH, Kim JH. A comprehensive review on the synthesis, characterization, and biomedical application of platinum nanoparticles. Nanomaterials. 2019;9(12):1719. doi:10.3390/nano9121719
10. Boote BW, Byun H, Kim JH. Silver-gold bimetallic nanoparticles and their applications as optical materials. J Nanosci Nanotechnol. 2014;14(2):1563–1577. doi:10.1166/jnn.2014.9077
11. Khatami M, Alijani HQ, Sharifi I. Biosynthesis of bimetallic and core-shell nanoparticles: their biomedical applications – a review. IET Nanobiotechnol. 2018;12(7):879–887. doi:10.1049/iet-nbt.2017.0308
12. Kim SJ, Choi SJ, Jang JS, et al. Exceptional high-performance of pt-based bimetallic catalysts for exclusive detection of exhaled biomarkers. Adv Mater. 2017;29(36):1–9. doi:10.1002/adma.201770257
13. Mandal R, Baranwal A, Srivastava A, Chandra P. Evolving trends in bio/chemical sensor fabrication incorporating bimetallic nanoparticles. Biosens Bioelectron. 2018;117:546–561. doi:10.1016/j.bios.2018.06.039
14. Tang J, Jiang X, Wang L, et al. [email protected] nanostructures: a novel photothermal conversion agent for cancer therapy. Nanoscale. 2014;6(7):3670–3678. doi:10.1039/c3nr06841b
15. He W, Liu Y, Yuan J, et al. [email protected] nanostructures as oxidase and peroxidase mimetics for use in immunoassays. Biomaterials. 2011;32(4):1139–1147. doi:10.1016/j.biomaterials.2010.09.040
16. Liu X, Zhang X, Zhu M, et al. PEGylated [email protected] nanodendrites as novel theranostic agents for computed tomography imaging and photothermal/radiation synergistic therapy. ACS Appl Mater Interfaces. 2017;9(1):279–285. doi:10.1021/acsami.6b15183
17. Wang R, Wang AJ, Liu WD, et al. A novel label-free electrochemical immunosensor for ultra-sensitively detecting prostate specific antigen based on the enhanced catalytic currents of oxygen reduction catalyzed by core-shell [email protected] nanocrystals. Biosens Bioelectron. 2018;102:276–281. doi:10.1016/j.bios.2017.11.041
18. Yang Q, Peng J, Xiao Y, et al. Porous [email protected] nanoparticles: therapeutic platform for tumor chemo-photothermal co-therapy and alleviating doxorubicin-induced oxidative damage. ACS Appl Mater Interfaces. 2018;10(1):150–164. doi:10.1021/acsami.7b14705
19. Wen T, Yang A, Wang T, et al. Ultra-small platinum nanoparticles on gold nanorods induced intracellular ROS fluctuation to drive megakaryocytic differentiation of leukemia cells. Biomater Sci. 2020;8(22):6204–6211. doi:10.1039/D0BM01547D
20. Shin SS, Noh DH, Hwang B, et al. Inhibitory effect of [email protected] on proliferation, migration, and invasion of EJ bladder carcinoma cells: involvement of cell cycle regulators, signaling pathways, and transcription factor-mediated MMP-9 expression. Int J Nanomedicine. 2018;13:3295–3310. doi:10.2147/IJN.S158463
21. Wen T, Zhang H, Chong Y, Wamer WG, Yin JJ, Wu X. Probing hydroxyl radical generation from H2O2 upon plasmon excitation of gold nanorods using electron spin resonance: molecular oxygen-mediated activation. Nano Res. 2016;9(6):1663–1673. doi:10.1007/s12274-016-1060-7
22. Yang Y, Xu G, Xu S, Chen S, Xu A, Wu L. Effect of ionic strength on bioaccumulation and toxicity of silver nanoparticles in Caenorhabditis elegans. Ecotoxicol Environ Saf. 2018;165:291–298. doi:10.1016/j.ecoenv.2018.09.008
23. Walkey CD, Chan WC. Understanding and controlling the interaction of nanomaterials with proteins in a physiological environment. Chem Soc Rev. 2012;41:2780–2799. doi:10.1039/C1CS15233E
24. Chakraborty D, Mohan L, Alex SA, Chandrasekaran N, Mukherjee A. Bimetallic gold nanorods with enhanced biocorona formation for doxorubicin loading and sustained release. Biomater Sci. 2018;7:63–75. doi:10.1039/C8BM01127C
25. Reference ranges of hematology data of healthy female C57BL/6 mice were obtained from Charles river laboratories. Available from: https://www.criver.com/products-services/find-model/c57bl6-mouse?region=3611. Accessed May 1, 2022.
26. Fernandes DP, Pimentel MML, Santos FAD, et al. Hematological and biochemical profile of BALB/c nude and C57BL/6 SCID female mice after ovarian xenograft. An Acad Bras Cienc. 2018;90(4):3941–3948. doi:10.1590/0001-3765201820180586
27. Qin Y, Lee Y, Seo J, Kim T, Shin JH, Park SH. NIH3T3 Directs memory-fated CTL programming and represses high expression of PD-1 on antitumor CTLs. Front Immunol. 2019;11:761. doi:10.3389/fimmu.2019.00761
28. Rahimi N, Kazlauskas A. A role for cadherin-5 in regulation of vascular endothelial growth factor receptor 2 activity in endothelial cells. Mol Biol Cell. 1999;10:3401–3407. doi:10.1091/mbc.10.10.3401
29. Susanto I, Wright SE, Lawson RS, Williams CE, Deneke SM. Metallothionein, glutathione, and cystine transport in pulmonary artery endothelial cells and NIH/3T3 cells. Am J Physiol. 1998;274:L296–300. doi:10.1152/ajplung.1998.274.2.L296
30. Liu J, Hu X, Hou S, et al. [email protected] core/shell nanorods with peroxidase-and ascorbate oxidase-like activities for improved detection of glucose. Sens Actuators B. 2012;166:708–714. doi:10.1016/j.snb.2012.03.045
31. Fischer HC, Liu LC, Pang KS, Chan WC. Pharmacokinetics of nanoscale quantum dots: in vivo distribution, sequestration and clearance in the rat. Adv Funct Mater. 2006;16:1299–1305. doi:10.1002/adfm.200500529
32. Brown AL, Kai MP, DuRoss AN, Sahay G, Sun C. Biodistribution and toxicity of micellar platinum nanoparticles in mice via intravenous administration. Nanomaterials. 2018;8(6):410. doi:10.3390/nano8060410
33. Black KC, Wang Y, Luehmann HP, et al. Radioactive 198Au-doped nanostructures with different shapes for in vivo analyses of their biodistribution, tumor uptake, and intratumoral distribution. ACS Nano. 2014;8(5):4385–4394. doi:10.1021/nn406258m
34. Xue Y, Zhang S, Huang Y, et al. Acute toxic effects and gender-related biokinetics of silver nanoparticles following an intravenous injection in mice. J Appl Toxicol. 2012;32(11):890–899. doi:10.1002/jat.2742
35. Luyts K, Napierska D, Nemery B, Hoet PH. How physico-chemical characteristics of nanoparticles cause their toxicity: complex and unresolved interrelations. Environ Sci Process Impacts. 2013;15(1):23–38. doi:10.1039/C2EM30237C
36. Schieber M, Chandel NS. ROS function in redox signaling and oxidative stress. Curr Biol. 2014;24(10):R453–462. doi:10.1016/j.cub.2014.03.034
37. Nel A, Xia T, Mädler L, Li N. Toxic potential of materials at the nanolevel. Science. 2006;311(5761):622–627. doi:10.1126/science.1114397
38. Xu B, Xu ZF, Deng Y, Yang JH. Protective effects of Chlorpromazine and Verapamil against cadmium-induced kidney damage in vivo. Exp Toxicol Pathol. 2010;62(1):27–34. doi:10.1016/j.etp.2008.12.009
39. Shi H, Magaye R, Castranova V, Zhao J. Titanium dioxide nanoparticles: a review of current toxicological data. Part Fibre Toxicol. 2013;10:15. doi:10.1186/1743-8977-10-15