Hybrid Biosilica Nanoparticles for in-vivo Targeted Inhibition of Colorectal Cancer Growth and Label-Free Imaging

Introduction
Metastasis continues to be the primary cause of mortality in colorectal cancer (CRC),1 driven by the regenerative capacity of stem-like cells that initiate tumor growth at distant sites.2 Despite significant advancements in managing localized disease, the prognosis for metastatic CRC remains poor, highlighting the urgent need for more effective therapeutic strategies. Chemotherapy, while a critical component of treatment, is often limited by drug resistance and systemic toxicity,3 emphasizing the need for innovative approaches.
Nanomedicine has emerged as a promising avenue in CRC treatment,4 offering tailored interventions with enhanced efficacy and specificity compared to conventional methods. Engineered nanoparticles (NPs) fabricated from a variety of materials serve as versatile carriers capable of encapsulating therapeutic payloads while addressing the limitations of chemotherapy.5,6 Active targeting strategies, which employ ligands on NP surfaces to target malignant cells, have shown potential to enhance drug delivery efficiency.7
Among NPs, diatomite nanoparticles (DNPs) are noteworthy for their unique properties. Recent studies have demonstrated their versatility in biomedical applications, including CRC treatment.8 Our study focuses on the development of hybrid nanosystems of DNPs and gold nanoparticles (AuNPs), embedded in gelatin (Gel), actively targeting metastatic CRC via L1CAM recognition and binding.
These hybrid nanosystems provide a multifaceted approach to cancer therapy. They not only facilitate the delivery of therapeutic agents but also enable the visualization and sensing of drug distributions within tumor cells. By harnessing the unique properties of AuNPs, such as their plasmonic resonance, label-free Raman imaging can precisely map the distribution of both the nanoparticles and the drug within the tumor microenvironment.9–11 This advanced imaging modality provides valuable insights into the pharmacokinetics and pharmacodynamics of the drug, facilitating a deeper understanding of its therapeutic efficacy. Moreover, acting as a protective shield for the drug payload, gelatin ensures the controlled drug release through its pH-dependent unfolding mechanism, protecting the drug payload from degradation and making the release triggerable by internal stimuli for enhanced therapeutic impact. Together, these features empower our nanosystems to not only actively deliver therapeutic payloads but also to monitor their distribution in real-time, paving the way for personalized and precision medicine in the treatment of CRC.
Transforming growth factor-beta (TGF-β) signaling is a crucial pathway implicated in CRC progression. Mutational inactivation of TGF-β signaling occurs in a significant proportion of CRC patients and is associated with poor prognosis.12 High levels of TGF-β1 in patients with CRC are also linked to adverse outcomes13 highlighting the complexity of TGF-β signaling in cancer.14 Importantly, TGF-β signaling is a key regulator of the epithelial-to-mesenchymal transition (EMT) process, through which epithelial cells turn into mesenchymal-like cells with enhanced metastatic, migratory, and invasive properties implicated in cancer metastasis.15,16
Ganesh et al identified L1CAM as a marker for a tumor-initiating subpopulation in CRC with poor outcomes, making it a potential therapeutic target.17,18 Cave et al further showed that L1CAM, induced by Nodal (part of the TGF-β family), enhances CRC cell migration and liver metastasis.19 Combining TGF-β inhibition with 5-Fluorouracil (5-FU) effectively reduced the tumorigenic and metastatic properties of L1CAM-high CRC cells.19 Studies have shown that L1CAM is a direct downstream target of TGF-β, creating a feedback loop that promotes CRC progression and metastasis.20
Over the years, several FDA-approved drugs have been tested for their ability to inhibit EMT in CRC and extend patient survival. Among them, Galunisertib (LY2157299, LY), a small molecule inhibitor of the TGF-β receptor type I, has shown promising results in reducing the metastatic potential of CRC cells.21 The use of LY alongside neoadjuvant chemoradiotherapy raised the complete response rate to 32% in locally advanced CRC but requires additional evaluation in randomized trials. Our study investigates the intracellular delivery of LY, by exploring the therapeutic potential of active-targeted hybrid nanosystems in CRC treatment. By functionalizing DNPs with an anti-L1CAM antibody, we target tumor-initiating cells expressing L1CAM, thereby inhibiting tumor growth and metastasis outspread22 (Scheme 1a). By targeting the TGF-β signaling and its downstream effector L1CAM, our study aims to inhibit EMT and reduce tumor aggressiveness in CRC by blocking the canonical TGF-β/Smad pathway, specifically through the inhibition of SMAD2 phosphorylation. We provide insights into the relationship between antibody functionalization and targeting efficiency of metastatic cells by quantifying the antibody density at the single-NP level, further assessing our nanosystem’s potential for CRC therapy.
Through in vitro and in vivo investigations, we evaluate the efficacy of our hybrid nanosystems in reducing CRC growth (Scheme 1b). Advanced techniques like Raman micro-spectroscopy (RM) play a crucial role in investigating the effective penetration of DNPs in CRC tumors in mice, as well as their distribution of DNPs within tumor tissues. RM allows for highly specific and label-free analysis, eliminating the need for fluorescent labels in vivo, which can be unstable or unsafe for living organisms.23–25 Additionally, by visualizing the precise localization of our nanosystems within the tumor microenvironment, RM is crucial for determining the differential efficacy of the nanovector with and without the antibody for active targeting, providing valuable insights into the benefits of targeted drug delivery, as well as the drug availability, in the tumor, guiding the optimization of treatment strategies (Scheme 1c).
In summary, our research offers novel perceptions into nanomedicine-based approaches for targeted CRC therapy, highlighting the promise of hybrid nanosystems in addressing treatment challenges and improving patient outcomes. Through a multidisciplinary approach integrating nanotechnology, cancer biology, and advanced imaging techniques, we aim to advance the field of CRC treatment and pave the way for personalized therapeutic interventions tailored to individual patient needs.
Materials and Methods
Materials
Diatomite was obtained by DEREF Spa (Castiglione in Teverina, Viterbo, Italy). 1-ethyl-3-[3-dimethylaminopropyl] carbodiimide-hydrochloride (EDC) (cat. 03450), N-hydroxysuccinimide (NHS) (cat. 130672), 3- aminopropyltriethoxysilane (APTES) (cat. 440140), type-B gelatin (cat. G6650), 2-(N-Morpholino) ethane sulfonic acid hemisodium salt (MES) (cat. M8250), tetrachloroauric acid (HAuCl4) (cat. 520918), dicarboxylic polyethylene glycol (PEG600), sodium tetrahydridoborate (NaBH4) (cat. 480886), sulfuric acid (H2SO4), sodium dodecyl sulfate (SDS), trifluoroacetic acid (TFA) and acetone HPLC grade were purchased from Merck KGaA. Phosphate Buffered Saline 1× (PBS) (cat. 10010023), Eagle’s Minimum Essential Medium (EMEM) (cat. 16209961) and Dulbecco Modified Eagle Medium (DMEM) (cat. 41966-029) were purchased from GIBCO. Chloride acid (HCl) was purchased from Romil. Galunisertib (LY2157299) (cat. HY-13226) was purchased from Axon Medchem. Recombinant PrA, fluorescein isothiocyanate (FITC)-labeled PrA, mouse monoclonal anti-L1CAM antibody (cat. NB100-2682) and Texas Red-conjugated antibody (cat. NBP1-73623) were purchased from Biotechne. Fetal Bovine Serum (FBS) (cat. ECS0180L) and Trypsin-EDTA (cat. ECB3052) were purchased from Euroclone. Matrigel Basement Membrane Matrix (cat. 356237) was provided by Corning. Penicillin/streptomycin (cat. AU-L0022) was purchased from Aurogene. The 4’,6-diamidino-2-phenylindole (DAPI) (cat. D1306), goat anti-mouse IgG (H+L) cross-adsorbed secondary antibody, Alexa Fluor™ 568, Hoechst, Alexa 488-labeled phalloidin (cat. A12379), and ProLongTM gold antifade mountant were purchased from Invitrogen, Thermo Fisher Scientific. Penicillin and Streptomycin were purchased from Aurogene.
Preparation of DNPs-AuNPs-LY@Gel-Ab
DNPs were derived from natural diatomite powder and amino-modified as described previously.9,26,27
The initial functionalization step involved the in-situ synthesis of gold nanoparticles on the surface of DNPs (DNPs-AuNPs). For this, 125 µg of amino-modified DNPs were dispersed in 10−3 M HAuCl4 aqueous solution (2.5 mL) and stirred gently for 10 min. Subsequently, 0.2 mL of PEG were added and stirred vigorously for 5 min. Finally, 0.15 mL of 0.1M NaBH4 aqueous solution was introduced. The change in color dispersion from yellow to red confirmed the reduction of gold salts and the formation of AuNPs on the DNPs’ surface after NaBH4 addition. The resulting DNPs-AuNPs dispersion was centrifuged to remove excess reagents (3500 rpm,10 min), the supernatant was discarded, and the residue was thoroughly washed with Milli-Q H2O.
The second step involved the drug loading (LY) in DNPs-AuNPs and simultaneously capping them with Gel (DNPs-AuNPs-LY@Gel). LY was entrapped in the Gel layer by incubating DNPs-AuNPs with a suspension of LY in gelatin, allowing the polymer to crosslink around the NPs and entrap the drug. Specifically, 125 µg of DNPs-AuNPs were suspended in a 10 mm MES (pH 3.5) mix reaction of 0.5% gel and 175 µg mL–1 LY for 2 h.26 Gel crosslinking was achieved by adding an aqueous solution of 0.4 µM EDC and 0.1 µM NHS to the NP dispersion, stirring for 2 h at 37°C (400 rpm). The weight ratio between Gel, EDC, and NHS was 1:1.4:0.2, respectively. After cross-linking, the gelatin-covered DNPs-AuNPs-LY (DNPs-AuNPs-LY@Gel) were washed with Milli-Q H2O and collected.
The third step involved the functionalization of the DNPs-AuNPs-LY@Gel with the Ab anti-L1CAM (DNPs-AuNPs-LY@Gel-Ab). To attach the Ab to the NPs, PrA was covalently linked to the gelatin shell of DNPs-AuNPs-LY@Gel to ensure the Ab’s correct orientation on the DNPs. For this purpose, the NPs were suspended in a 0.1 mg mL–1 PBS solution of PrA with µM EDC and 0.8 µM NHS and stirred for 2 h (400 rpm). Then, the suspension was centrifuged, the supernatant removed, and the NPs washed three times with PBS. PrA-modified DNPs-AuNPs-LY@Gel were then incubated with a 0.8 µg mL–1 Ab solution for 2 h. Finally, the ab-modified nanoformulation (DNPs-AuNPs-LY@Gel-Ab) was washed to eliminate physisorbed Ab molecules, centrifuged, and collected.
Physicochemical Characterization of DNPs-AuNPs-LY@Gel-Ab
The hydrodynamic diameter and surface ζ-potential of the developed NPs were measured using a Zetasizer ZS Nano instrument (Malvern Instruments Ltd., UK). The UV-Vis spectra of DNPs-AuNPs, DNPs-AuNPs-LY@Gel, and DNPs-AuNPs-LY@Gel-PrA were recorded on Cary 100 UV-Vis double beam spectrophotometer (Agilent, CA, USA) using quartz cells of 10 mm path at room temperature. Samples were dispersed in deionized H2O, and peak analysis was performed using OriginPro 2016 (Origin Lab, Northampton, MA, USA). The fluorescence imaging of labeled formulations was assessed by fluorescence microscopy (Leica Microscope) by drying 0.05 mg of NP suspensions on silicon slides. The morphology of the NPs was investigated before and after surface modifications using a transmission electron microscope (TEM, Jeol JEM-1400, Jeol Ltd, Japan). The surface modification of NPs was evaluated by micro-Fourier InfraRed spectroscopy (Nicolet iN10, Thermo Fisher Scientific). FTIR spectra were recorded in the wavenumber region 2500-670 cm−1 with a resolution of 4 cm−1.
Drug Loading Capacity Studies of the NPs
The LC of DNPs was evaluated by RP-HPLC. To achieve this, 100 µg of DNPs-AuNPs-LY@Gel-Ab were immersed in 1 mL of PBS pH 7.2 supplemented with trypsin 0.07 mg mL–1 for 4 h to degrade the gelatin matrix and favor the complete release of LY.26,27 The NPs were centrifuged, and the supernatant containing the released LY was collected and analyzed by RP-HPLC using a Discovery® C18 Column (Merck, DE) stationary phase (5 µm particle size, 150×4.6 mm). Mobile phase A comprised TFA 0.02% v/v in H2O, whereas mobile phase B was TFA 0.02% v/v in acetonitrile (ACN). The flow rate and wavelength were set at 1 mL min–1 and 254 nm, respectively. The amount of loaded/released drug was quantified using an external calibration method and the LC was determined using Equation 1:
(1)
Assessment of Protein and Anti-L1CAM Antibody Binding Efficiency to Nanoparticles
To determine the extent of PrA and Ab binding to the surface of DNPs, we conjugated FITC-labeled prA (PrA*) to DNPs-AuNPs-LY@Gel. Subsequently, PrA*-modified DNPs-AuNPs-LY@Gel underwent digestion in a 0.07 mg mL–1 trypsin solution for 1 h at 37°C, resulting in the degradation of the gelatin shell and detachment of PrA* from the DNPs. The suspension was centrifuged and the supernatant, containing the degraded gelatin and PrA*was analyzed by using a PerkinElmer LS 55 Luminescence spectrometer (PerkinElmer Inc.) under a 488 nm excitation. The fluorescence emission of the released PrA*peaked at 517 nm, was interpolated in the titration curve (Figure S4) obtained analyzing samples containing known masses of PrA* in the range included between 0 and 0.7 µg. Within this range, the curve exhibits a linear behavior; each point reported in the Figure S4 is the result of three independent experiments. The procedure allowed for the calculation of the PrA* mass released from the DNPs. The experiment was repeated five times. The value of the released PrA* mass is reported in the manuscript as the mean ± standard deviation.
For the quantification of Ab binding efficiency, Texas Red-conjugated polyclonal Ab (Ab*) was bound to DNPs-AuNPs-LY@Gel-PrA following the procedures. Protein A binding to the Ab exhibits stereoselectivity towards the Fc portion, thus being independent of the structural variability of the Fab region. Therefore, a polyclonal Ab was chosen as the model antibody for assessing the binding efficiency of PrA to Ab. The suspension was then treated with a hot (90°C) solution of 2% SDS for 15 min under continuous heating to denature the protein and release Ab* in the supernatant. The emission intensity of Ab*peaked at 605 nm, was measured by the luminescence spectrometer under a 530 nm excitation. The mass of released Ab* was quantified using a titration curve (Figure S6) obtained analyzing samples containing known masses of Ab* in the range included between 0 and 0.6 µg. The experiment was repeated five times. The value of the released Ab* mass is reported in the manuscript as the mean ± standard deviation.
Cell Culture
The human colon cancer cell lines LS.174T and SW620, obtained from ATCC (American Type Culture Collection, Rockville, Maryland) were cultured in DMEM, supplemented with FBS (10% v/v) and penicillin/streptomycin (50 units mL–1) at 37°C in a 5% CO2 atmosphere. The human normal colonic cells CRL-1790, obtained from ATCC were cultured in EMEM supplemented with FBS (10% v/v) and penicillin/streptomycin (50 units mL–1) at 37°C in a 5% CO2 atmosphere. Cells identity (annually) and Mycoplasma free-state (bi-weekly) were routinely tested by DNA fingerprinting using short tandem repeat profiling and using the PCR-based MycoAlert Mycoplasma Detection Kit (Lonza, Bioscience), respectively. Each cell line was used for passage 4–5 after thawing from frozen initial vials. FACS, qPCR, and migration experiments were conducted by plating cells at the density of 30×103 cells well−1 in serum-free DMEM for 24 hours to reduce basal cellular activity. For gene expression analysis, LS.174T, SW620, and CRL-1790 cells were seeded in a 24-well plate, and after 24 hours the cells were treated with DNPs-AuNPs (20 μg mL–1), DNPs-AuNPs-LY@Gel (20 μg mL–1), DNPs-AuNPs-LY@Gel-Ab (20 μg mL–1) in serum-free media for 24 hours. Lastly, the cells were harvested by EDTA-trypsin, washed twice with PBS, and collected by centrifugation.
Flow Cytometry
FACS was performed using anti-human L1CAM, DNPs-AuNPs-LY@Gel-Ab, and fluorescent secondary antibody. Samples were analyzed by flow cytometry using a FACS Canto II (BD), and data were analyzed with FlowJo 9.2 software (Ashland, OR). Experiments were repeated a minimum of three independent times with triplicate samples. The Student’s t-test assessed statistical significance.
Confocal Fluorescence Imaging
For testing the L1CAM expression by immunofluorescence, CRL-1790 (50,000 cells well−1), LS.174T, and SW620 (150,000 cells well−1) were placed on glass coverslips in 24-well plates. The day after, cells were washed three times with PBS 1× and fixed using 4% (v/v) paraformaldehyde for 15 minutes at room temperature (RT). Coverslips were incubated with blocking solution (BS, 0.02% saponin, 0.5% BSA, and 50 mm ammonium chloride in PBS) for 1 h at RT. Then, the anti-L1CAM antibody (250 ng mL–1) was dissolved in BS and incubated with coverslips overnight at 4°C. After 3 washing in PBS 1×, coverslips were incubated with 250 ng μL−1 secondary antibody (Goat anti-Mouse IgG (H+L) Cross-Adsorbed Secondary Antibody, Alexa Fluor™ 568) dissolved in BS for 45’ at RT. Coverslips were washed 3 times in PBS 1× and mounted using the ProLongTM gold antifade mounting (Invitrogen) as mounting media. Cells were analyzed by confocal microscopy (LSM 700 by Zeiss). Experiments were repeated a minimum of three independent times.
LS.174T and SW620 cells were plated on glass coverslips in 24-well plates at a density of 150,000 cells well−1 to test the nanocarrier binding specificity. The day after, cells were treated with 20 μg mL–1 of fluorescent DNPs*-AuNPs-LY@Gel-PrA, and DNPs*-AuNPs-LY@Gel-Ab resuspended in a culture medium without serum. DNPs*-AuNPs-LY@Gel-PrA and DNPs*-AuNPs-LY@Gel-Ab were obtained by labeling DNPs-AuNPs with the red fluorochrome CFTM568, Succinimidyl Ester (Sigma-Aldrich, cat. SCJ4600027) before drug loading and Gel capping. After 24 hours of treatment, cells were fixed as described above. Nuclei were stained using 2 μg mL–1 Hoechst, while filamentous actin was stained with 33 nM Alexa 488-labeled phalloidin (Invitrogen). The staining agents dissolved in BS, and coverslips were incubated with the staining agents for 1 h at RT. Then, coverslips were mounted and analyzed by confocal microscopy (LSM 980 Airyscan 2 by Zeiss). Cell-associated fluorescence was calculated using ImageJ software, analyzing at least 30 images for each sample. Experiments were repeated a minimum of three independent times with triplicate samples. The Student’s t-test assessed statistical significance.
RNA Preparation and Real-Time PCR
Total RNAs from human colon cancer cells were extracted with the Eurogold TRIFAST kit (Euroclone, cat. EMR507100) according to the manufacturer’s instructions. One microgram of total RNA was used for cDNA synthesis with High-Capacity reverse transcriptase (Thermofisher, cat. 4368814). Quantitative real-time PCR (qPCR) was performed using the SYBR Green PCR master mix (Thermofisher, cat. 4309155), according to the manufacturer’s instructions. The list of utilized primers is depicted in Table S1.
Migration Assays
Migration assays were performed using Boyden chambers (Corning, cat. CLS3401-48EA). Briefly, after 24 hours of treatment with DNPs-AuNPs (20 μg mL–1), DNPs-AuNPs-LY@Gel (20 μg mL–1), DNPs-AuNPs-LY@Gel-Ab (20 μg mL–1), 2.5·104 CRL-1790, LS.174T, and SW620 cells were added to the inserts of the chamber for 22 hours at 37°C. Migrated cells were fixed in 4% PFA (Thermo Fisher, cat. 15670799), and stained with DAPI. The ratio of cells in the lower chamber versus total seeded cells was calculated. The Student’s t-test assessed statistical significance.
Matrigel Embedding Culture Assay
After 24 hours of treatment with DNPs-AuNPs (20 μg mL–1), DNPs-AuNPs-LY@Gel (20 μg mL–1), DNPs-AuNPs-LY@Gel-Ab (20 μg mL–1), 5·103 of CRL-1790, LS.174T, and SW620 cells were embedded in 50 µL of 100% Matrigel and seeded in 24 multi-well plates (Corning). The formed spheres, here termed organoids-like structures, were cultured in Cancer Stem Cells (CSCs) media composed of advanced DMEM: F12 (GIBCO, cat. 11320033) supplemented with 1× glutaMAX (GIBCO, cat. 35050061), 1× B-27 (GIBCO, cat. 17504044), 1× N2 (GIBCO, cat. 17502048), 20 ng mL–1 bFGF (basic fibroblast growth factor) (Invitrogen, cat. 13256–029) and 50 ng mL–1 EGF (epidermal growth factor) (Peprotech, cat. AF-100-15). Organoid-like structures were grown for seven days and counted using a light microscope. The Student’s t-test assessed statistical significance.
Tumor Growth
All animal experiments were approved by the Italian Ministry of Health (IACUC protocol #554/2022-PR) prior to the commencement of the study. All the procedures were performed in the animal facility at IGB-CNR under pathogen-free conditions in accordance with Regulations for the Council Directive 2010/63/EU on the protection of animals used for scientific and experimental purposes. The IGB-CNR animal facility is authorized by the Ministry of Health according to the Italian law on animal experimentation (D.L. 26/2014).
Single-cell suspensions of 6·106 SW620 cells were subcutaneously injected into six-week-old nude athymic male mice (Charles River Laboratories). When tumors reached 100 mm3 (around 15 days post-injection), mice were randomized and treated with intratumor injections (80 μL) of vehicle (PBS), LY (1.25 μg), DNPs-AuNPs (25 μg), DNPs-AuNPs-LY@Gel (25 μg), and DNPs-AuNPs-LY@Gel-Ab (25 μg), respectively, every two days for a week. Tumor take was monitored visually and by palpation every week. Tumor diameter and volume were calculated based on caliper tumor length and height measurements using the formula: tumor volume. Animals were considered to bear a tumor when the maximal tumor diameter was about 2 mm, The Student’s t-test assessed the statistical significance of tumor volume.
Hematoxylin and Eosin Staining in FFPE
According to standard procedures, Hematoxylin and Eosin (H&E) were carried out using 4-μm FFPE tissue sections. Briefly, the sections on slides were submerged into Lillie-Mayer’s hematoxylin solution (Sigma, cat. H9627) for 10 min, then rinsed in tap water for 2 min. Subsequently, the slides were submerged into 2% alcoholic eosin solution (Sigma, cat. 861006) for 2 min. Slides were drained well, and sections were dehydrated through an ascending alcohol bath series (30, 50, 70, 95, and 100%, 1 min each) and cleared in xylene (Sigma, cat. 1.08297) for 5 min. Finally, the slides were air-dried and mounted in Distrene Plasticizer Xylene (D.P.X., cat. 06522) for histology (Sigma). Each sample was evaluated using a light LEICA DM6000 inverted microscope (Leica, Heidelberg, Germany) with a DC 350 FX camera (Leica).
Raman Micro-Spectroscopy
Tumoral paraffin sections were deposited on a Raman grade CaF2 coverslip and subjected to a dewaxing process before RM analysis. Briefly, samples were immersed in a xylene solution for 3 min and then re-hydrated through a descending alcohol bath series (100, 95, 70, 50%, 3 min each). Then sections were immersed in distilled water for 2–5 min and stored in water at 4°C until further analysis.
Raman analyses were carried out using an inverted confocal Raman microscope (XploRA INV, Horiba Jobin Yvon) equipped with a 532 nm wavelength diode laser and an X60 water immersion objective (Nikon, Ti-2000 Eclipse, Nikon Instruments Europe BV, Amsterdam, Netherlands, Numerical aperture NA=1.2). The aperture of the entrance slit of the monochromator was set at 100 μm. The Raman image was acquired by raster scanning over a selected squared tissue region (50×50= 2500 spectra per sample were collected with an integration time of 1 s per spectrum) through the laser focus with a step size of 0.5 μm. The laser power on the samples was about 2 mW, and no photodamage of the tissue was observable at the employed laser energy. After cosmic ray removal and baseline correction, Raman false-color images were constructed using the Classical Least Squares (CLS) fitting method. All the analyses were done using the HORIBA Scientific Lab Spec 6 software (Horiba Jobin Yvon). The spectra/loadings of the tissue sample constituents used to generate the Raman map are shown in Figure S10.
Statistical Analysis
Results for continuous variables are presented as means ± standard deviation (SD) of at least three independent experiments. Treatment groups were compared with the independent-sample t-test. qPCR has been repeated a minimum of 3 independent times in triplicate. p < 0.05 was considered statistically significant. All analyses were performed using GraphPad Prism 7.
Results and Discussion
Fabrication and Characterization of the NPs
The hybrid DNPs-AuNPs-LY@Gel-Ab were synthesized starting from porous silica diatomite nanoparticles (DNPs), which were in-situ decorated with gold nanoparticles (AuNPs). Afterward, the drug, LY, was loaded into the nanosystem, and the entire complex was encapsulated with a gelatin shell. As previously shown,9 the gelatin shell is pH-sensitive, meaning it degrades and releases the drug in an acidic environment, mimicking tumor conditions, while simultaneously preventing the premature release of the drug. The NPs were further modified by incorporating an anti-L1CAM antibody to actively target CRC tumor cells, overexpressing the L1CAM receptor, and consequently improving the specificity and efficacy of the drug delivery system in-vivo. To this aim, DNPs-AuNPs-LY@Gel were firstly modified with the protein A (PrA) through covalent bond between the ̶ COOH and ̶ NH2 groups of Gel and PrA. Then, PrA-modified DNPs anchored the Ab by binding its Fc region, thanks to the facilitated orientation of the Fc towards DNPs promoted by the PrA. This functionalization approach made both the antigen-binding fragments (Fab) available on the NPs to recognize and bind to the L1CAM antigen on cancer cells. The fabrication process is schematized in Scheme 1.
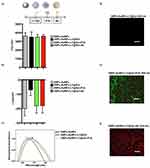
NPs were characterized after each fabrication step. Dynamic Light Scattering (DLS) was used to investigate the mean size and surface ζ-potential of NPs in colloidal suspension (Figure 1a and b). DNPs-AuNPs exhibited a mean hydrodynamic diameter of 360 ± 40 nm and a surface ζ-potential of −20 ± 5 mV. The negative value of ζ-potential stemmed from the carboxyl groups (̶ COOH) of dicarboxylic PEG, utilized as a stabilizing agent in AuNPs synthesis and still present after washings. LY was loaded in the DNPs-AuNPs using an entrapping method involving incubating NPs with both LY and Gel, which was left to crosslink via carbodiimide chemistry. Following Gel capping, the NPs’ size remained relatively constant, 350 ± 60 nm, while the surface ζ-potential became −7 ± 4 due to the presence of both ̶ COOH and amino (̶ NH2) groups on the gel layer. After PrA immobilization, the size and surface ζ-potential of DNPs were 350 ± 30 nm and −18 ± 5, respectively. The increased surface ζ-potential enhanced surface repulsion forces between NPs, stabilizing the colloidal suspension, while the mean hydrodynamic diameter remained stable within the margin of error. The size and surface ζ-potential did not change after Ab immobilization, remaining at 360 ± 20 nm and −18 ± 5, respectively.
The morphology of the nanocomplex was evaluated using transmission electron microscopy (TEM) analysis. The DNPs exhibited an irregular shape with a porous structure, consistent with previous observations.9 The analysis confirmed that the nanosystem measured approximately 400 nm in size, with in-situ synthesized AuNPs with a mean size of about 25 nm, and pores ranging from 10 to 35 nm (Figure S1).
Figure 1c shows the absorbance spectra of DNPs-AuNPs acquired by Ultraviolet-visible (UV-Vis) spectroscopy after each surface modification. The plasmon resonance DNPs-AuNPs, attributed to the Localized Surface Plasmon Resonance (LSPR) of AuNPs, was observed at 561.5 ± 0.7 nm but shifted red by 7 ± 5 nm following drug loading and gelatin capping. The attachment of PrA on the DNPs-AuNPs-LY@Gel further red-shifted the LSPR by 5 ± 3 nm due to increasing changes in the refractive index in the NPs’ surroundings. No shift was observed upon attachment of the Ab to the formulation, which was confirmed spectrophotometrically. The lack of LSPR shift is attributed to the rapid decay of the plasmonic field with distance, which diminishes the interaction between the antibody and the nanoparticle’s surface plasmons. To confirm the attachment of PrA, the DNPs-AuNPs-LY@Gel were modified with fluorescein isothiocyanate (FITC)-conjugated PrA (PrA*) and imaged. At the same time, the efficacy of DNPs-AuNPs-LY@Gel-PrA to bind the Ab was assessed by incubating them with Texas Red-conjugated polyclonal ab (Ab*). After drying the samples on a silicon substrate, the fluorescence microscopy imaging (Figure 1d) revealed that DNPs-AuNPs-LY@Gel did not exhibit fluorescence under a 488 nm wavelength excitation. However, following the bond PrA*-Gel, DNPs-AuNPs-LY@Gel-PrA* showed a robust green emission provided by the labeled prA* (Figure 1e). Finally, upon incubation with the Ab* and excitation at 530 nm wavelength, DNPs-AuNPs-LY@Gel-Ab* (Figure 1f) showed a strong red fluorescence, confirming the effective ab functionalization.
An additional characterization of the surface modification of NPs was performed by FTIR analysis. FTIR spectra of DNPs-AuNPs, DNPs-AuNPs-LY@Gel, and DNPs-AuNPs-LY@Gel-Ab are reported in Figure S2. The spectrum of DNPs-AuNPs was characterized by two Si-O-Si bands at 1100 and 800 cm−1, respectively. A peak at 1600 cm−1 related to N–H bending (amine II) appeared in the spectrum of DNPs-AuNPs-LY@Gel due to the presence of the gelatin layer. After the antibody immobilization, the band intensity at 1600 cm−1 increased due to the N–H labeling of the antibody. These results are in agreement with previously published data.9,26,28
We evaluated the loading capacity (LC) of DNPs-AuNPs-LY@Gel-Ab by immersing the NPs in 1 mL of PBS pH 7.2 supplemented with trypsin for four h to degrade the gelatin matrix and favoring the LY release.28 After centrifugation, the supernatant containing the released LY was analyzed by reverse-phase-high-performance liquid chromatography (RP-HPLC). The amount of LY in the supernatant was 50 μg mg−1 of DNPs, corresponding to a 5.0 ± 0.5% LC. This value exceeded the LCs calculated in our previous work,9 thanks to the elevated gel concentration employed for the capping layer around the NPs.28 Additionally, it reflects the outcomes of further optimization in the parameters utilized for Gel crosslinking. Indeed, we showed that the loading capacity of the nanosystem can be modulated by adjusting the concentration and thickness of the gelatin in the external shell.28
The stability of NPs under physiological conditions was also evaluated. To this aim, DLS measurements of the DNPs-AuNPs-LY@Gel incubated in serum-free cell medium for 48 hours at 37°C were conducted. The results, reported in Figure S3, did not show any significant nanoparticle aggregation, confirming the stability of DNPs-AuNPs-LY@Gel.
Evaluation of Antibody Surface Coverage
The quantification of antibody immobilization on the NP is crucial for assessing its ability to target a specific cell population. Typically, the surface coverage of an antibody immobilized on a solid surface is indirectly quantified by analyzing the remaining molecules in the supernatant after functionalization. However, this indirect quantification method is prone to high errors and potential overestimation of data. It relies on the assumption that antibodies do not adhere to the walls of reaction tubes.29 This work quantified the number of Ab molecules immobilized on a single DNP using a direct fluorescence-based method.
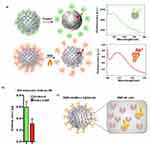
As the anchoring of the Ab to the DNP was mediated by the PrA to ensure correct orientation, we initially assessed the surface coverage of PrA on the NPs. The labeled PrA* was immobilized on 100 μg of DNPs-AuNPs-LY@Gel, the suspension was washed, and the DNPs-AuNPs-LY@Gel-PrA* underwent enzymatic degradation with trypsin. This process degrades the gelatin layer, releasing PrA molecules into the supernatant. The amount of released PrA* was determined by comparing the maximum fluorescence emission of the solution (peaked at 517 nm, Figure 2a, upper) with a titration curve of the molecule (Figure S4). The experiment, repeated five times, allowed for the calculation of the PrA* mass released from 100 μg DNPs as (0.6 ± 0.1) μg, corresponding to (8.6 ± 1.4) × 1012 PrA molecules based on the assumed molecular weight of 42 kDa (Figure S5). Afterward, we calculated the number of molecules present per unit of DNP, knowing their size and density. To this aim, we used a standard statistical method based on error propagation. According to DLS analysis, the mean hydrodynamic diameter of a DNP is (360 ± 40) nm. Using a diatomite density30 of 2.25×10⁻⁶ μg μm3, we determined that each DNP had a mass of (5 ± 2) × 10−8 μg, and that 100 μg of DNPs corresponded to (1.8 ± 0.6) × 109 NPs. The calculated number of prA molecules per unit of DNP was (5 ± 2) × 103, demonstrating a high functionalization efficiency provided by the porous surface of the DNPs.
In a subsequent experiment, we immobilized the Texas Red-conjugated antibody (Ab*) onto 100 μg of DNPs-AuNPs-LY@Gel. The NPs underwent incubation with 2% sodium dodecyl sulfate (SDS) and exposure to 90°C to denature the PrA, facilitating the Ab* release in the solution. Fluorescence of the released Ab* was investigated at 605 nm emission wavelength (Figure 2a, lower) and compared to a titration curve (Figure S6) to quantify the mass of the Ab* released from 100 µg of DNPs. The experiment, repeated five times, allowed for the quantification of the Ab* mass as (0.28 ± 0.09) μg. Assuming a molecular weight of 150 kDa for each Ab* molecule, the Ab* mass corresponds to (1.1 ± 0.4) × 1012 molecules released from 100 µg of DNPs, resulting in an unprecedented coverage of (6 ± 3) × 102 molecules per single NP.
The estimated numbers of PrA and Ab molecules released from a single DNP are detailed in Figure 2b. The inference drawn suggested that only two antibodies per ten proteins are immobilized, likely due to the steric hindrance imposed by the Ab molecules over the surface of the DNP (Figure 2c). The measured coverages on DNPs exceeded values reported in the literature for other inorganic nanoparticles31 affirming the efficacy of the functionalization procedure.
Reversion of Metastatic Cancer Cells Cultured in 2D and 3D Conditions by Targeted Therapy
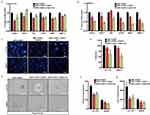
Epithelial-to-mesenchymal transition (EMT) is a complex cellular process involving the loss of epithelial characteristics, such as polarity and cell-cell interactions, and acquiring mesenchymal traits. In the context of cancer, EMT is closely associated with heightened migratory and invasive capabilities. We recently established a correlation between elevated L1CAM expression in CRC and increased cell aggressiveness concurrent with the initiation of EMT, fostering tumorigenicity and metastasis.19 To counteract the aggressive phenotype associated with high L1CAM levels in CRC, we evaluated the efficacy of active-targeted DNPs for delivering LY to cells expressing heightened L1CAM. Experiments were conducted on three distinct CRC cell types: CRC-1790 (human normal colon cells) lacking L1CAM expression; LS.174T, expressing low levels of L1-CAM; SW620 cells, characterized by abnormal L1CAM levels.26,32 We checked the expression of L1CAM in the selected cell lines by immunofluorescence (IF) and fluorescence-activated cell sorting (FACS) using an anti-L1CAM antibody. Both IF and FACS (Figure S7a and b) confirmed that L1CAM is highly expressed on the SW620 cell surface, while it is poorly represented by LS.174T and not expressed in CRL-1790 cells. The ability of DNPs-AuNPs-LY@Gel-Ab to efficiently recognize cells expressing a high level of L1CAM was preliminarily investigated by confocal fluorescence microscopy. To this aim, cells were treated with DNPs*-AuNPs-LY@Gel-PrA and DNPs*-AuNPs-LY@Gel-Ab for 24 hours (h). DNPs-AuNPs*-LY@Gel-PrA and DNPs-AuNPs*-LY@Gel-Ab were obtained by labeling DNPs-AuNPs with a red fluorochrome (ie, CFTM568, Succinimidyl Ester) before drug loading and Gel capping. No significative differences were observed in the recognition of both cell lines by DNPs-AuNPs*-LY@Gel-PrA. After 24 h, just a few DNPs were internalized at the same level by both cell types, probably due to passive endocytosis processes (Figure 3a).
On the other hand, DNPs-AuNPs*-LY@Gel-Ab were able to recognize SW620 cells in a more efficient and specific manner compared to LS.174T cells (Figure 3b). After 24 h, the amount of DNPs-AuNPs*-LY@Gel-Ab visible in the cytosol was higher in SW620 than in LS.174T cells (Figure 3b). This data is further confirmed by quantifying the cell-associated DNPs*-AuNPs-LY@Gel-Ab fluorescence reported in Figure 3c. The results of confocal fluorescence imaging indicate that DNPs-AuNPs*-LY@Gel-Ab could recognize CRC cells expressing high levels of L1CAM in a precise and efficient way. Notably, no changes in cell growth were observed after 24 and 48 hours of treatment with any of the indicated nanoplatforms in both LS.174T and SW620 cell lines, suggesting that the DNPS are non-toxic to the cells (Figure S8a and b).
DNPs-AuNPs, DNPs-AuNPs-LY@Gel, or DNPs-AuNPs-LY@Gel-Ab effects on the expression of genes involved in EMT were evaluated by quantitative real-time PCR (qPCR). The treatment of CRL-1790 cells with DNPs-AuNPs, DNPs-AuNPs-LY@Gel, or DNPs-AuNPs-LY@Gel-Ab, showed no changes in the expression of mesenchymal transcription factors, namely SNAIL1, TWIST1, and vimentin (VIM). Similarly, there were no discernible alterations in the levels of invasiveness-associated genes, namely CXC motif chemokine receptor 4 (CXCR4), matrix metalloproteinases-2 (MMP2), and MMP10 (Figure S9a). The treatment of LS.174T cells with DNPs-AuNPs-LY@Gel induced a significant decrease in the expression of mesenchymal and invasiveness-associated genes compared to DNPs-AuNPs (Figure 4a), in line with our previous publication.9 However, treatment with DNPs-AuNPs-LY@Gel-Ab did not result in further reduction of the genes compared to DNPs-AuNPs-LY@Gel, suggesting that the effect is independent of active targeting (Figure 4a). In the cell line overexpressing L1CAM, SW620, the treatment with DNPs-AuNPs-LY@Gel did not decrease mesenchymal genes, while invasiveness-associated genes were notably reduced upon treatment. Interestingly, treatment with DNPs-AuNPs-LY@Gel-Ab significantly impaired the expression of both mesenchymal and invasiveness-associated genes (Figure 4b), suggesting a powerful effect on the EMT inhibition can be achieved with the active-targeted nanoplatform. Previous reports have indicated that an increased mesenchymal phenotype associated with high L1CAM content is linked to enhanced migratory capacities of CRC cells.17 Utilizing a Boyden chamber migration assay, we demonstrated that treatment of both LS.174T and SW620 cells with DNPs-AuNPs-LY@Gel resulted in a notable decrease in the migratory potential (Figure 4c and d). Furthermore, SW620 cell migration was significantly reduced in the presence of DNPs-AuNPs-LY@Gel-Ab and with higher efficacy than LS.174T and normal CRL-1790 cells (Figure S9b and c).
In recent years, the advancements in three-dimensional culture methods have become essential for molecular biology-related studies, especially CRC research. Compared to conventional culture systems, these methods offer improved predictions of cancer patients’ sensitivity to chemotherapy and better recapitulation of the human in vivo environment. We performed an organoid-like culture of CRC cells embedded in Matrigel to assess the efficacy and specificity of active targeting in a more physiological environment. After 7 days of culture, treatment with DNPs-AuNPs-LY@Gel induced a reduction in the number and size of both LS.174T and SW620 organoids compared to therapy with DNPs-AuNPs alone (Figure 4e–g). Notably, treatment with DNPs-AuNPs-LY@Gel-Ab resulted in a more significant decrease in the number and size of SW620 organoids compared to therapy with DNPs-AuNPs-LY@Gel (Figure 4e–g).
Collectively, these data suggest that active targeting of DNPs with an anti-L1CAM antibody enhances the effects of LY in reducing the mesenchymal phenotype and migratory capacity of cells expressing high levels of L1CAM compared to corresponding non-functionalized nanocarriers.
In-vivo Reversion of EMT by Local Injection
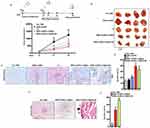
To further elucidate our findings, we assessed the efficacy of DNPs-AuNPs-LY@Gel and DNPs-AuNPs-LY@Gel-Ab in inhibiting tumor growth in vivo. Notably, this study marks the first administration of DNPs for targeted therapy against CRC in vivo. Mouse xenograft models were established by subcutaneously injecting SW620 cells into the flank of athymic nude mice. Once the tumors reached a size of 100 mm3 (approximately on day 15), the mice were randomized into five groups and treated intratumorally with the following regimens: PBS, LY (1.25 μg), DNPs-AuNPs (25 μg), DNPs-AuNPs-LY@Gel (25 μg), DNPs-AuNPs-LY@Gel-Ab (25 μg). The treatments were administered every two days for a week. Tumor growth was monitored for 7 days post-treatment, and at around day 28, the mice were sacrificed. Tumors were measured, and subsequently, they were disaggregated for further analysis.
In the mice treated with LY alone, we observed a slight reduction of tumor mass, while no effect was observed in the cohort of mice treated with PBS or DNPs-AuNPs, thus confirming the drug’s efficacy (Figure 5a and b). Treatment with DNPs-AuNPs-LY@Gel resulted in a significant reduction in tumor growth, and this effect was comparable to that of DNPs-AuNPs-LY@Gel-Ab (Figure 5a and b). SW620 tumors were excised from mice, sectioned, and stained with hematoxylin and eosin (H&E) to observe histopathological changes (Figure 5c and d). Xenografts treated with DNPs-AuNPs showed no phenotypical changes in tumors compared to untreated control specimens (Figure 5c). In contrast, treatment with LY changes tumor morphology, both in the case of the free drug and when encapsulated in nanocarriers with or without antibodies. This morphological alteration is evidenced by the presence of necrotic areas in the tumors and further supported by the quantification of necrosis, which is significantly more pronounced in tumors treated with DNPs-AuNPs-LY@Gel, but markedly more in those treated with DNPs-AuNPs-LY@Gel-Ab compared to PBS-treated tumors (Figure 5d). While there were no observable differences in growth rate and size or histological sections from the superficial part of the tumor, the scenario changes significantly in the innermost part of the tumor. H&E staining on innermost tumor sections revealed that treatment with DNPs-AuNPs-LY@Gel-Ab causes tumor collapse, and there are no intact structures. The tumors appear much softer even to the touch (Figure 5e). In contrast, in tumors treated with DNPs-AuNPs-LY@Gel, cellular structures are still observable (Figure 5e and f). These data indicate that antibody-labeled DNPs enable targeted delivery of LY to tumor sites in vivo, significantly reducing tumor growth and aggressiveness.
Molecular Mechanism of TGF-β Signaling Inhibition
LY specifically inhibits TGF-β receptor I kinase, which downregulates the phosphorylation of SMAD2, a key mediator in the TGF-β signaling pathway.33 By blocking this pathway, LY can potentially reduce tumor growth and enhance anti-tumor immunity, making it a candidate for CRC treatment.
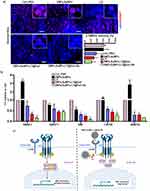
To evaluate the efficacy of LY in blocking the TGF-β/Smad signaling pathway, we assessed the phosphorylation status of SMAD2 (pSMAD2). Immunofluorescence analysis on tumor sections revealed that treatment with DNPs-AuNPs-LY@Gel-Ab significantly enhanced the efficacy of LY in reducing pSMAD2 levels (Figure 6a–c). One of the outcomes of blocking the TGF-β/Smad signaling pathway is the decrease in EMT-related genes. To assess whether changes in the expression of mesenchymal markers had occurred, we performed qPCR analysis on RNA derived from tumors. The results showed that DNPs-AuNPs-LY@Gel-Ab significantly reduced the expression of SNAIL1, TWIST1, and Vimentin mesenchymal genes along with genes associated with aggressiveness, including CXCR4 and MMP10 (Figure 6b and c).
Intratumoral NP Distribution Investigated by Raman Micro-Spectroscopy
As described earlier, H&E staining of the innermost part of SW620 tumors revealed that DNPs-AuNPs-LY@Gel-Ab treatment destroyed the tumoral tissue architecture. However, H&E staining did not visualize the presence of DNPs-AuNPs-LY@Gel-Ab within the innermost tumoral mass. To address this limitation, SW620 tumoral tissues from control mice or treated with DNPs-AuNPs-LY@Gel and DNPs-AuNPs-LY@Gel-Ab were also analyzed by RM.
RM is a label-free vibrational spectroscopic technique widely used in medical research and diagnosis;34–37 RM provides highly specific information about a sample molecular and biochemical composition by studying the inelastic scattering of light by the molecules in a cell and/or tissue without fluorescent label.38 The Raman spectrum presents crucial information, with each peak corresponding to a specific molecular bond. It’s worth noting that RM can generate a false-color image known as a Raman map, providing both spectral and spatial information in a label-free manner. Moreover, the presence of AuNPs amplifies the Raman signal, enabling the precise visualization of drug release in cells, as evidenced in our recent paper.9 In this study, this signal amplification is leveraged to localize the distribution of nanoparticles within the tumor tissue. Indeed, AuNPs possess a unique spectrum (Figure S10, right panel), facilitating their specific identification and localization within complex samples like tumoral tissue (the Raman spectrum of tumoral tissue is illustrated in Figure S10, middle panel). Notably, the distinct Raman signal of the drug LY is not visible, indicating complete drug release, while the amplified gold signal remains detectable, allowing for the precise visualization of the nanocarrier within the tissue.
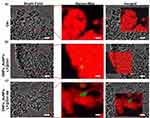
The Figure 7 shows the bright field images (left panels), the Raman maps (middle panels), and the merged images (right panels) of tumoral tissue from untreated (Figure 7a) and mice treated with either DNPs-AuNPs-LY@Gel (Figure 7b) or DNPs-AuNPs-LY@Gel-Ab (Figure 7c). The bright field image shows the effect of the DNPs-AuNPs-LY@Gel-Ab treatment on tumor architecture as the tissue appears less compact and organized (Figure 7c, right panel) than the tumors treated or not with DNPs-AuNPs-LY@Gel (Figure 7a and b, respectively; right panels). Raman maps (Figure 7, middle panels) reveal the presence of both the DNPs-AuNPs-LY@Gel (Figure 7b, showed in green; middle panels) and DNPs-AuNPs-LY@Gel-Ab (Figure 7c, showed in green; middle panels) within the tumoral tissue (showed in red), with a slightly higher increased concentration in the latter case.
RM confirmed the presence of nanoparticles within the tumor tissue, clearly demonstrating their ability to penetrate the tumor mass, which was not detectable through H&E staining. The Raman maps showed a statistically significant higher concentration of nanoparticles in the tissue treated with DNPs-AuNPs-LY@Gel-Ab compared to the non-targeted DNPs-AuNPs-LY@Gel. This greater accumulation of nanoparticles in the tissue (green spots), along with the more extensive necrotic zones (black areas) further underscores the enhanced efficacy of the targeted treatment. These findings highlight the advantages of active targeting in improving nanoparticle delivery into the tumor mass. Crucially, the localization of nanoparticles within tissue was examined with excellent specificity and without the need for labeling agents thus circumventing potential instability or safety concerns associated with fluorescent dyes in living organisms.
Furthermore, the ability to visualize nanoparticles within the tumor opens possibilities for direct measurements in live mice, facilitating real-time monitoring of drug delivery and efficacy.
Conclusions
This study introduces an innovative hybrid nanoplatform designed for targeted therapy against metastatic colorectal cancer (CRC). The nanosystem integrates gelatin-embedded DNPs, gold nanoparticles, and the anticancer drug LY. Functionalized with antibodies targeting L1CAM, a marker highly expressed in metastasis-initiating cells, the nanoplatform ensures precise targeting and minimizes off-target effects. The effectiveness of the nanosystem functionalization was confirmed through quantification of antibody density per nanoparticle, which facilitates enhanced uptake by L1CAM-positive cells.
The nanoplatform’s efficacy was validated both in vitro and in vivo. In 2D and 3D culture models, DNPs-AuNPs-LY@Gel-Ab selectively targeted CRC cells overexpressing L1CAM, delivering the drug effectively and reducing the mesenchymal phenotype and invasiveness-related gene expression. In vivo, intratumoral injection of the nanoplatform led to a significant reduction in tumor growth, with similar efficacy observed between targeted and untargeted systems. Histological analysis confirmed the inhibition of the mesenchymal phenotype and revealed extensive necrotic regions in tissue treated with the actively targeted nanoparticles, indicating their superior therapeutic effect. Furthermore, Raman imaging allowed for label-free visualization of nanoparticle distribution within the tumor, showing the effective intratumoral migration of the NPs and higher accumulation of the targeted nanoplatform (DNPs-AuNPs-LY@Gel-Ab) compared to its untargeted counterpart.
In summary, this hybrid nanoplatform demonstrates strong potential for targeted therapy against metastatic CRC, providing enhanced specificity and therapeutic efficacy. Specifically, the excellent results were obtained by functionalizing the nanoparticles with only 600 antibodies per NP, due to the spatial limitations posed by this type of antibody. However, we anticipate further improvements by optimizing the type of antibody used, potentially enhancing the overall efficacy of the nanoplatform. The ability to visualize nanoparticle distribution in vivo using RM offers new opportunities for real-time monitoring of drug delivery and nanoparticle behavior in cancer treatment, laying the foundation for further exploration and a transformative impact on cancer therapy.
Acknowledgments
We are grateful to members of the Animal House of IGB-ABT and Euro-Bioimaging Infrastructure at IEOS. We thank Annalisa Di Domenico (IGB) and Alessandro Esposito (IEOS) for their support in conducting some of the experiments during the revision of this work. This work was supported by: AIRC Bridge Grant #27012, Young Researchers-MSCA-PNR-MUR # MSCA_0000023 and PNC 0000001_D3 4 health to E.L.; AIRC IG grant # 21420 to A.C.D.L.; FIMP and Fondazione Umberto Veronesi to D.D.C. This work is partially supported by the NextGenerationEU Project PNRR-SEE LIFE – Strengthening the Italian Infrastructure of Euro-Bioimaging (IR23 – DD MUR 3264/21 CUPB53C22001810006).
Author Contributions
All authors made significant contributions to the work reported, whether in the study design, execution, data acquisition, analysis and interpretation. They participated in drafting, revising, and critically reviewing the article; gave final approval of the version to be published; agreed on the journal to which the article has been submitted; and agreed to be accountable for all aspects of the work. I.R., A.C.D.L., and E.L. conceived the study, supervised the work, and contributed to the acquisition of the findings.
Disclosure
Chiara Tramontano is currently affiliated with Internal Medicine Department, Radboud University Medical Center, Radboud, The Netherlands. The authors report no conflict of interest in this work.
References
1. Siegel RL, Miller KD, Jemal A. Cancer statistics, 2020. CA A Cancer J Clin. 2020;70(1):7–30. doi:10.3322/caac.21590
2. Batlle E, Clevers H. Cancer stem cells revisited. Nat Med. 2017;23(10):1124–1134. doi:10.1038/nm.4409
3. Holohan C, Van Schaeybroeck S, Longley DB, Johnston PG. Cancer drug resistance: an evolving paradigm. Nat Rev Cancer. 2013;13(10):714–726. doi:10.1038/nrc3599
4. Wicki A, Witzigmann D, Balasubramanian V, Huwyler J. Nanomedicine in cancer therapy: challenges, opportunities, and clinical applications. J Control Release. 2015;200:138–157. doi:10.1016/j.jconrel.2014.12.030
5. Blanco E, Shen H, Ferrari M. Principles of nanoparticle design for overcoming biological barriers to drug delivery. Nat Biotechnol. 2015;33(9):941–951. doi:10.1038/nbt.3330
6. Zhang X, Lai Y, Zhang L, et al. Chitosan-modified molybdenum selenide mediated efficient killing of helicobacter pylori and treatment of gastric cancer. Int J Biol Macromol. 2024;275:133599. doi:10.1016/j.ijbiomac.2024.133599
7. Bertrand N, Wu J, Xu X, Kamaly N, Farokhzad OC. Cancer nanotechnology: the impact of passive and active targeting in the era of modern cancer biology. Adv Drug Deliv Rev. 2014;66:2–25. doi:10.1016/j.addr.2013.11.009
8. Ruggiero I, Terracciano M, Martucci NM, et al. Diatomite silica nanoparticles for drug delivery. Nanoscale Res Lett. 2014;9(1):329. doi:10.1186/1556-276X-9-329
9. Managò S, Tramontano C, Delle Cave D, et al. SERS quantification of galunisertib delivery in colorectal cancer cells by plasmonic-assisted diatomite nanoparticles. Small. 2021;17(34):2101711. doi:10.1002/smll.202101711
10. Eremina OE, Czaja AT, Fernando A, Aron A, Eremin DB, Zavaleta C. Expanding the multiplexing capabilities of raman imaging to reveal highly specific molecular expression and enable spatial profiling. ACS Nano. 2022;16(7):10341–10353. doi:10.1021/acsnano.2c00353
11. Managò S, Migliaccio N, Terracciano M, et al. Internalization kinetics and cytoplasmic localization of functionalized diatomite nanoparticles in cancer cells by Raman imaging. J Biophoton. 2018;11(4):e201700207. doi:10.1002/jbio.201700207
12. Massagué J. TGFβ in Cancer. Cell. 2008;134(2):215–230. doi:10.1016/j.cell.2008.07.001
13. Calon A, Espinet E, Palomo-Ponce S, et al. Dependency of colorectal cancer on a TGF-β-driven program in stromal cells for metastasis initiation. Cancer Cell. 2012;22(5):571–584. doi:10.1016/j.ccr.2012.08.013
14. Batlle E, Massagué J. Transforming growth factor-β signaling in immunity and cancer. Immunity. 2019;50(4):924–940. doi:10.1016/j.immuni.2019.03.024
15. Lu W, Kang Y. Epithelial-mesenchymal plasticity in cancer progression and metastasis. Dev Cell. 2019;49(3):361–374. doi:10.1016/j.devcel.2019.04.010
16. Padua D, Massagué J. Roles of TGFβ in metastasis. Cell Res. 2009;19(1):89–102. doi:10.1038/cr.2008.316
17. Ganesh K, Basnet H, Kaygusuz Y, et al. L1CAM defines the regenerative origin of metastasis-initiating cells in colorectal cancer. Nat Cancer. 2020;1(1):28–45. doi:10.1038/s43018-019-0006-x
18. Ganesh K, Stadler ZK, Cercek A, et al. Immunotherapy in colorectal cancer: rationale, challenges and potential. Nat Rev Gastroenterol Hepatol. 2019;16(6):361–375. doi:10.1038/s41575-019-0126-x
19. Cave DD, Hernando-Momblona X, Sevillano M, Minchiotti G, Lonardo E. Nodal-induced L1CAM/CXCR4 subpopulation sustains tumor growth and metastasis in colorectal cancer derived organoids. Theranostics. 2021;11(12):5686–5699. doi:10.7150/thno.54027
20. Schäfer H, Struck B, Feldmann E-M, et al. TGF-Β1-dependent L1CAM expression has an essential role in macrophage-induced apoptosis resistance and cell migration of human intestinal epithelial cells. Oncogene. 2013;32(2):180–189. doi:10.1038/onc.2012.44
21. Yamazaki T, Gunderson AJ, Gilchrist M, et al. Galunisertib plus neoadjuvant chemoradiotherapy in patients with locally advanced rectal cancer: a single-arm, Phase 2 trial. Lancet Oncol. 2022;23(9):1189–1200. doi:10.1016/S1470-2045(22)00446-6
22. Ganesh K, Massagué J. Targeting metastatic cancer. Nat Med. 2021;27(1):34–44. doi:10.1038/s41591-020-01195-4
23. Yang J, Wang Z, Zong S, Chen H, Zhang R, Cui Y. Dual-mode tracking of tumor-cell-specific drug delivery using fluorescence and label-free SERS techniques. Biosens Bioelectron. 2014;51:82–89. doi:10.1016/j.bios.2013.07.034
24. Huang B, Yan S, Xiao L, et al. Label-free imaging of nanoparticle uptake competition in single cells by hyperspectral stimulated raman scattering. Small. 2018;14(10):1703246. doi:10.1002/smll.201703246
25. Yigit MV, Zhu L, Ifediba MA, et al. Noninvasive MRI-SERS imaging in living mice using an innately bimodal nanomaterial. ACS Nano. 2011;5(2):1056–1066. doi:10.1021/nn102587h
26. Tramontano C, Martins JP, De Stefano L, et al. Microfluidic-assisted production of gastro-resistant active-targeted diatomite nanoparticles for the local release of galunisertib in metastatic colorectal cancer cells. Adv Healthc Mater. 2022;12:2202672. doi:10.1002/adhm.202202672
27. Rea I, Martucci NM, De Stefano L, et al. Diatomite biosilica nanocarriers for siRNA transport inside cancer cells. Biochim Biophys Acta. 2014;1840(12):3393–3403. doi:10.1016/j.bbagen.2014.09.009
28. Tramontano C, Miranda B, Chianese G, et al. Design of gelatin-capped plasmonic-diatomite nanoparticles with enhanced galunisertib loading capacity for drug delivery applications. Int J Mol Sci. 2021;22(19):10755. doi:10.3390/ijms221910755
29. Filbrun SL, Driskell JD. A fluorescence-based method to directly quantify antibodies immobilized on gold nanoparticles. Analyst. 2016;141(12):3851–3857. doi:10.1039/C6AN00193A
30. Reka AA, Pavlovski B, Fazlija E, et al. Diatomaceous earth: characterization, thermal modification, and application. Open Chem. 2021;19(1):451–461. doi:10.1515/chem-2020-0049
31. Xu H, Lu JR, Williams DE. Effect of surface packing density of interfacially adsorbed monoclonal antibody on the binding of hormonal antigen human chorionic gonadotrophin. J Phys Chem B. 2006;110(4):1907–1914. doi:10.1021/jp0538161
32. Gavert N, Sheffer M, Raveh S, et al. Expression of L1-CAM and ADAM10 in human colon cancer cells induces metastasis. Cancer Res. 2007;67(16):7703–7712. doi:10.1158/0008-5472.CAN-07-0991
33. Deng Z, Fan T, Xiao C, et al. TGF-β signaling in health, disease and therapeutics. Sig Transduct Target Ther. 2024;9(1):61. doi:10.1038/s41392-024-01764-w
34. Mangini M, Ferrara MA, Zito G, et al. Cancer metabolic features allow discrimination of tumor from white blood cells by label-free multimodal optical imaging. Front Bioeng Biotechnol. 2023;11:1057216. doi:10.3389/fbioe.2023.1057216
35. Elumalai S, Managó S, De Luca AC. Raman microscopy: progress in research on cancer cell sensing. Sensors. 2020;20(19):5525. doi:10.3390/s20195525
36. Qi Y, Liu Y, Luo J. Recent application of Raman spectroscopy in tumor diagnosis: from conventional methods to artificial intelligence fusion. PhotoniX. 2023;4(1):22. doi:10.1186/s43074-023-00098-0
37. Mangini M, Limatola N, Ferrara MA, et al. Application of Raman spectroscopy to the evaluation of F-actin changes in sea urchin eggs at fertilization. Zygote. 2024;32(1):38–48. doi:10.1017/S0967199423000552
38. Chernenko T, Matthäus C, Milane L, Quintero L, Amiji M, Diem M. Label-free raman spectral imaging of intracellular delivery and degradation of polymeric nanoparticle systems. ACS Nano. 2009;3(11):3552–3559. doi:10.1021/nn9010973
