A Novel Nomogram to Differentiate Between Renal Tuberculosis and Nontuberculous Renal Infection
Department of Urology, Hangzhou Red Cross Hospital, Hangzhou, People’s Republic of China
Correspondence: Yong Qin, Department of Urology, Hangzhou Red Cross Hospital, 208 East Huancheng Road, Hangzhou, 310003, People’s Republic of China, Tel +86571-56108764, Email [email protected]
Background: To build a diagnostic nomogram for differentiating between renal tuberculosis (RTB) and nontuberculous renal infection.
Methods: Eligible patients were randomly categorized into derivation and validation cohorts (7:3). Univariate and multivariate regression analyses were conducted to filter variables and select predictors. Multivariate logistic regression was employed for model construction and nomogram were used for visualization. The nomogram was evaluated by Concordance index (C-index), calibration curves and decision curve analysis (DCA).
Results: Overall, 194 patients were included. The derivation and validation cohorts included 75 and 61 patients and 32 and 26 patients with RTB and nontuberculous renal infection, respectively. We included previous TB history, CRP levels, fever, chronic infection and hydronephrosis in the construction of the nomogram. A nomogram was developed and validated. This nomogram exhibited good discrimination and calibration. The C-indices of this nomogram in the derivation and validation cohorts was 0.99 and 0.98 (95% confidence intervals, 0.97– 1.00 and 0.96– 1.01), respectively. DCA revealed that the proposed nomogram was useful for the differentiation.
Conclusion: The nomogram can differentiate between RTB and nontuberculous renal infection.
Keywords: diagnostic nomogram, renal tuberculosis, nontuberculous renal infection, decision curve analysis
Introduction
Tuberculosis (TB) is an infectious disease caused by Mycobacterium tuberculosis (MTB). Presently, TB constitutes one of the top 10 causes of death globally.1 In 2021, the mortality rate associated with TB increased for the first time in 9 years.2 TB remains a serious threat to public health. Although it typically affects the lungs (pulmonary tuberculosis [PTB]), it can also affect other organs (extrapulmonary tuberculosis [EPTB]).3 Urogenital tuberculosis (UGTB) is the second most common form of EPTB, representing ~27% of EPTBs.4 In developed countries, UGTB accounts for 2–10% of PTB cases, whereas the figure is 15–20% in developing countries.5–8 Renal tuberculosis (RTB) constitutes the most common form of UGTB.9 The clinical symptoms of RTB are non-specific, which is one of the most important reasons for delaying its diagnosis. For a long period, RTB diagnosis depended on the determination of acid-fast bacilli (AFB) in smears and urine MTB cultures. These bacteriological methods are either slow or have low sensitivity, especially while using clinical specimens such as urine that contain only a small number of microorganisms.10 Therefore, effectively improving the probability of early RTB diagnosis remains challenging. Owing to the lack of sufficient clinical experience and specific detection methods, the misdiagnosis rate of RTB in primary hospitals is particularly high. Therefore, a predictive model to distinguish between RTB and nontuberculous renal infection need to be developed to help clinicians make judgments.
This retrospective study aimed to establish a diagnostic prediction model visualized via a nomogram to improve the accuracy and practicality of the differential diagnosis of RTB and nontuberculous renal infection.
Materials and Methods
Study Design and Patients
This study included consecutive patients with RTB and nontuberculous renal infection treated in Hangzhou Red Cross Hospital from January 2014 to December 2023. All patients were >18 years. Diagnosis of RTB was established when one of the following criteria was met: effective anti-TB treatment, positive MTB culture, or histopathological diagnosis. Diagnosis of nontuberculous renal infection was based on when one of the following criteria was met: effective antibiotic treatment, positive bacterial culture, or histopathological diagnosis of nontuberculous renal infection. This study included the epidemiological characteristics, clinical symptoms, laboratory test results and Imaging examination results (Ultrasound examination or CT scan) of patients. Demographic characteristics included: sex, age, diagnosis of diabetes, body mass index (BMI), immigrant status, previous TB history, smoking status, alcohol use. Clinical symptoms included: flank pain, lower urinary tract symptoms (LUTS), fever, gross hematuria, chronic infection. Laboratory test results included: positive urine leukocyte, positive urine nitrite, C-reactive protein (CRP) levels. Imaging examination results included: urinary tract stone and hydronephrosis. If patients have missing case data as mentioned above, they will be excluded from this study. This study was approved by the Human Research Ethics Committee of Hangzhou Red Cross Hospital.
Definition of Variables
Diagnosis of diabetes was accorded with the World Health Organization (WHO) criteria.11 Patients whose registered residence is not in Zhejiang were defined as immigrants. LUTS mainly referred to symptoms that included frequency, urgency, and dysuria. Chronic infection was defined as disease duration exceeding 3 months. Positive urine leukocyte and urine nitrite were identified via routine urine tests.
Data Analysis and Model Construction
R version 4.1.2 was used for statistical analysis. Categorical variables were expressed as frequencies and percentages (%). Continuous variables were expressed as mean ± standard deviation or median and range depending on the data distribution.
The patients were randomly categorized in a ratio of 7:3 into the derivation and validation cohorts. The derivation cohort was used to filter variables and construct the model, and the validation cohort was used to validate the model. The prediction model was developed using a two-step approach. In step one, univariable and multivariable logistic regression analysis was performed. Variables with P <0.05 in the univariable logistic regression analysis were included in multivariable logistic regression analysis. Following multivariable analysis, variables with P <0.05 were employed to further construct the model. Step two involved multivariable logistic regression analysis to calculate the odds ratio (OR) of each candidate variable and construct the predictive model, and evaluate multicollinearity through variance inflation factor (VIF). The model was visualized by constructing nomograph. The model was validated in the derivation and validation cohorts. The discrimination (C-index) and calibration (calibration curves and P value in the Hosmer–Lemeshow test) of the model were evaluated using the derivation and validation cohorts, respectively, and the performance of the model was comprehensively evaluated. Furthermore, decision curve analysis (DCA) of the model was performed.
Results
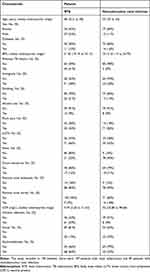
Finally, 194 patients were included in this study, of whom 107 had RTB and 87 had nontuberculous renal infection. The baseline characteristics of the patients are provided in Table 1. Of the 107 RTB patients, 30 were diagnosed by MTB culture, 17 by histopathology, and 60 by effective anti TB treatment. Of the 87 nontuberculous renal infection patients, 28 were diagnosed by bacterial culture, 1 by histopathology, and 58 by effective antibiotic treatment. The patients were randomly categorized into the derivation and validation cohorts. The former included 75 and 61 patients with RTB and nontuberculous renal infection (n = 136), and the latter included 32 and 26 patients with RTB and nontuberculous renal infection (n = 58), respectively.
|
Table 1 Patient Characteristics |
First, univariable analysis of the derivation cohort was performed. The following variables were included in the subsequent multivariable analysis: BMI, previous TB history, chronic infection, fever, sex, immigrant status, flank pain, CRP levels, urinary tract stone and hydronephrosis. Further multivariable regression analysis revealed that the final variables included in the prediction model were previous TB history, CRP levels, fever, chronic infection and hydronephrosis (Table 2). We included previous TB history, CRP levels, fever, chronic infection and hydronephrosis in the construction of the nomogram (Figure 1). Each variable is assigned different points based on the results through the nomogram. Different points can be assigned based on the different results of each variable. The total points were obtained by adding up the points of each variable. The OR value of each variable is shown in Table 3. The discrimination of the nomogram was validated in the derivation and validation cohorts. When the nomogram was used in the derivation cohort, the C-index was 0.99 (95% CI = 0.97–1.00), whereas in the validation cohort, the C-index was 0.98 (95% CI = 0.96–1.01). And the Hosmer–Lemeshow test yielded nonsignificant P values of 0.816 and 0.818 in the derivation and validation cohorts, respectively. This indicates that in both the derivation and validation cohorts, the calibration curve of the model demonstrated high consistencies between the predicted and observed values. The proposed model was well-calibrated (Figure 2).
 |
Table 2 Results of the Univariable and Multivariable Regression Analysis of the Derivation Cohort |
 |
Table 3 Predictors for the Nomogram |
 |
Figure 1 Nomogram for differentiate between RTB and nontuberculous renal infection. Recommended probability threshold of liner predictor: 0.805. |
 |
Figure 2 Calibration curves of the nomogram. (A) derivation cohort; (B) validation cohort. The vertical axis represents the actual renal tuberculosis rate, and the horizontal axis represents the predicted renal tuberculosis risk. The line Ideal represents the ideal situation where the predicted probability is always equal to the actual probability, line Apparel represents the consistency between the calculated risk probability based on this model and the actual probability, bias-corrected refers to the result of bootstrap-resampling of the data used to construct the model. The Hosmer–Lemeshow test, P>0.05, suggesting that it is of goodness-of-fit. |
Moreover, DCA was conducted to assess the clinical usefulness of the nomogram. The results revealed that using the proposed nomogram to differentiate between RTB and nontuberculous renal infection would obtain a net benefit for nearly all threshold probabilities in both the derivation and validation cohorts (Figure 3).
 |
Figure 3 Decision curves analysis of the nomogram. (A) derivation cohort; (B) validation cohort. The vertical axis represents the net benefit obtained by subtracting the patient’s risk from the patient’s benefit; the horizontal axis represents the threshold probability. Line None represents the net benefit for all patients with nontuberculous renal infection, line All represents the net benefit for all patients with renal tuberculosis, line Model 1 represents the overall net benefit of the prediction model within the threshold range. |
Discussion
UGTB is one of the most common EPTBs, accounting for approximately 30%–40% of all EPTB cases.12 UGTB is often secondary to PTB or EPTB of other organs. The interval between secondary UGTB and initial PTB or EPTB diagnosis can be as long as 30 years.13 2–20% of PTB patients develop UGTB through hematogenous spread to the kidneys, prostate, and epididymis.3 Diagnosis of EPTB is difficult due to the difficulty in obtaining test samples.14 Similarly, the clinical diagnosis of RTB remains challenging. Delayed diagnosis of RTB seriously threatens the physical and mental health of patients. MTB may spread to the ureter and bladder through urine.15 As shown in Table 1, RTB and nontuberculous renal infection have similar clinical manifestations. Patients with renal tuberculosis have a higher probability of developing hydronephrosis. The number of male and female patients with RTB is similar, while the proportion of female patients with nontuberculous renal infection is higher. The clinical characteristics of RTB become atypical because of various reasons such as the abuse of quinolone drugs, which increases the difficulty of early diagnosis of RTB.9 The diagnosis of RTB often depends on the determination of AFB in smears and MTB cultures. However, MTB and nontuberculous Mycobacterium both produce positive AFB smears.16 Waiting for the results of MTB culture takes a long time, which is not conducive to the rapid diagnosis of RTB. Recently, molecular biology technology has been widely used for diagnosing TB. A study which used MTB culture as the gold standard found the sensitivity and specificity of Xpert MTB/RIF assay in PTB diagnosis were 92.2% and 99.2%, respectively.17 Xpert MTB/RIF assay and other molecular biological techniques have also been used for RTB diagnosis, thereby improved early diagnosis rate of RTB.18,19 However, some primary hospitals may delay treatment owing to the lack of relevant experience and medical equipment. In recent years, biosensors have been constructed through modern integrated technologies, such as the combination of analytical chemistry, molecular biology, and nanotechnology. Integrated technology enhances the detection of highly selective, specific, and sensitive signals for detecting Mycobacterium tuberculosis.20
Nomograms are used widely in medicine.21 A useful nomogram will provide effective assistance to clinical doctors due to its user-friendly interface and good predictive performance.22 In our previous work, we have constructed and validated a diagnostic nomogram to differentiate between epididymal tuberculosis and bacterial epididymitis.23 We have found that early diagnosis of RTB is also difficult in clinical practice. Given the numerous similarities in the clinical manifestations between RTB and nontuberculous renal infection, better diagnostic tools to differentiate them must be developed. Therefore, we constructed a nomogram to distinguish between RTB and nontuberculous renal infection to help clinicians make judgments while diagnosing RTB.
The nomogram contained five variables: previous TB history, CRP levels, fever, chronic infection and hydronephrosis. In this study, we screened these variables through univariate and multivariate regression analysis. The nomogram was evaluated by C-index, calibration curves and DCA. In this study, the nomogram was used in the derivation cohort, the C-index was 0.99 (95% CI = 0.97–1.00), whereas in the validation cohort, the C-index was 0.98 (95% CI = 0.96–1.01), previous studies have shown that a C-index > 0.75 indicates that the model has high accuracy. The results confirmed the clinical feasibility of the model. Because our model was based on certain common clinical characteristics, laboratory examination results and imaging examination results, it is particularly suitable for application in primary hospitals and underdeveloped areas. Especially for medical institutions lacking rapid detection technologies such as molecular biology testing, it will be beneficial for early screening of RTB.
There are some limitations in our study. This study was a retrospective study not a prospective study and this study lacked validation of external data. Retrospective studies rely on existing clinical data, but such databases are not specifically designed for clinical research, so in most cases, it is inevitable that some data will be missing; In addition, some variables that may affect the outcome may not have been collected at all. The number of patients included was small, especially for patients with nontuberculous renal infection. We used univariable and multivariable logistic regression analysis to evaluate the variables. However, it may result in some clinically significant variables being excluded from the model. Thus, a prospective study with a large sample size is warranted. The inclusion of more cases will help in constructing a more reasonable model that can distinguish between RTB and nontuberculous renal infection.
Conclusions
In this retrospective study, we constructed and validated a diagnostic nomogram to differentiate between RTB and nontuberculous renal infection. This nomogram incorporated common demographics, clinical characteristics, laboratory examination parameters and imaging examination results of patients with epididymal TB. The results reveal that this nomogram exhibit good discrimination and calibration. Furthermore, DCA showed that a net benefit is achieved when the proposed nomogram is used to differentiate between RTB and nontuberculous renal infection. This nomogram may be of great value for distinguishing between RTB and nontuberculous renal infection.
Abbreviations
MTB, Mycobacterium tuberculosis; RTB, renal tuberculosis; TB, tuberculosis; PTB, pulmonary tuberculosis; EPTB, extrapulmonary tuberculosis; UGTB, urogenital tuberculosis; AFB, acid-fast bacilli; LUTS, lower urinary tract symptoms; DCA, decision curve analysis; ROC, receiver operating characteristic; AUC, area under the curve.
Data Sharing Statement
The datasets used and/or analyzed during the current study are available from the corresponding author on reasonable request.
Ethics Approval and Consent to Participate
This study complied with the declaration of Helsinki and this study was approved by the Human Research Ethics Committee of Hangzhou Red Cross Hospital (No: 2023-096). Informed consent was waived owing to the retrospective nature of the study and was approved by the Human Research Ethics Committee of Hangzhou Red Cross Hospital. In this study, we respected and protected the rights and privacy of participants, and ensured the confidentiality of their personal information.
Author Contributions
All authors made a significant contribution to the work reported, whether that is in the conception, study design, execution, acquisition of data, analysis and interpretation, or in all these areas; took part in drafting, revising or critically reviewing the article; gave final approval of the version to be published; have agreed on the journal to which the article has been submitted; and agree to be accountable for all aspects of the work.
Funding
This study was funded by Hangzhou Science and Technology Bureau (2023WJC090).
Disclosure
The authors declare that they have no competing interests in this work.
References
1. Chakaya J, Khan M, Ntoumi F, et al. Global tuberculosis report 2020 – reflections on the global TB burden, treatment and prevention efforts. Int J Infect Dis. 2021;113 Suppl 1(Suppl 1):S7–s12. doi:10.1016/j.ijid.2021.02.107
2. Chakaya J, Petersen E, Nantanda R, et al. The WHO global tuberculosis 2021 report – not so good news and turning the tide back to end TB. Int J Infect Dis. 2022;124 Suppl 1:S26–s9. doi:10.1016/j.ijid.2022.03.011
3. Kulchavenya E, Kholtobin D, Shevchenko S. Challenges in urogenital tuberculosis. World J Urol. 2020;38(1):89–94. doi:10.1007/s00345-019-02767-x
4. Toccaceli S, Persico Stella L, Diana M, et al. Renal tuberculosis: a case report. G Chir. 2015;36(2):76–78.
5. Psihramis KE, Donahoe PK. Primary genitourinary tuberculosis: rapid progression and tissue destruction during treatment. J Urol. 1986;135(5):1033–1036. doi:10.1007/s10096-020-04052-x
6. Alvarez S, McCabe WR. Extrapulmonary tuberculosis revisited: a review of experience at Boston City and other hospitals. Medicine. 1984;63(1):25–55. [PMID: 6419006]. doi:10.1097/00005792-198401000-00003
7. Gokalp A, Gultekin EY, Ozdamar S. Genito-urinary tuberculosis: a review of 83 cases. Br J Clin Pract. 1990;44(12):599–600. [PMID: 2102154]. doi:10.1111/j.1742-1241.1990.tb10113.x
8. Hemal AK, Gupta NP, Rajeev TP, Kumar R, Dar L, Seth P. Polymerase chain reaction in clinically suspected genitourinary tuberculosis: comparison with intravenous urography, bladder biopsy, and urine acid fast bacilli culture. Urology. 2000;56(4):570–574. doi:10.1016/s0090-4295(00)00668-3
9. Liu P, Wang Y, Hao S, Qin Y. Comparison of the CapitalBio™Mycobacterium RT-PCR detection test and Xpert MTB/RIF assay for diagnosis of renal tuberculosis. Eur J Clin Microbiol Infect Dis. 2021;40(3):559–563. doi:10.1007/s10096-020-04052-x
10. Ghaleb K, Afifi M, El-Gohary M. Assessment of diagnostic techniques of urinary tuberculosis. Mediterr J Hematol Infect Dis. 2013;5(1):e2013034. doi:10.4084/mjhid.2013.034
11. Alberti KG, Zimmet PZ. Definition, diagnosis and classification of diabetes mellitus and its complications. Part 1: diagnosis and classification of diabetes mellitus provisional report of a WHO consultation. Diabet Med. 1998;15(7):539–553. doi:10.1002/(sici)1096-9136(199807)15:7<539::Aid-dia668>3.0.Co;2-s
12. Figueiredo AA, Lucon AM, Junior RF, Srougi M. Epidemiology of urogenital tuberculosis worldwide. Int J Urol. 2008;15(9):827–832. doi:10.1111/j.1442-2042.2008.02099.x
13. Cek M, Lenk S, Naber KG, et al. EAU guidelines for the management of genitourinary tuberculosis. Eur Urol. 2005;48(3):353–362. doi:10.1016/j.eururo.2005.03.008
14. Scott LE, Beylis N, Nicol M, et al. Diagnostic accuracy of Xpert MTB/RIF for extrapulmonary tuberculosis specimens: establishing a laboratory testing algorithm for South Africa. J Clin Microbiol. 2014;52(6):1818–1823. doi:10.1128/jcm.03553-13
15. Figueiredo AA, Lucon AM, Srougi M. Urogenital Tuberculosis. Microbiol Spectr. 2017;5(1). doi:10.1128/microbiolspec.TNMI7-0015-2016
16. Waman VP, Vedithi SC, Thomas SE, et al. Mycobacterial genomics and structural bioinformatics: opportunities and challenges in drug discovery. Emerg Microbes Infect. 2019;8(1):109–118. doi:10.1080/22221751.2018.1561158
17. Boehme CC, Nabeta P, Hillemann D, et al. Rapid molecular detection of tuberculosis and rifampin resistance. N Engl J Med. 2010;363(11):1005–1015. doi:10.1056/NEJMoa0907847
18. Chen Y, Wu P, Fu L, Liu YH, Zhang Y, Zhao Y. Multicentre evaluation of Xpert MTB/RIF assay in detecting urinary tract tuberculosis with urine samples. Sci Rep. 2019;9(1):11053. doi:10.1038/s41598-019-47358-3
19. Samuel BP, Michael JS, Chandrasingh J, Kumar S, Devasia A, Kekre NS. Efficacy and role of Xpert(®) Mycobacterium tuberculosis/rifampicin assay in urinary tuberculosis. Indian J Urol. 2018;34(4):268–272. doi:10.4103/iju.IJU_189_18
20. Joshi H, Kandari D, Maitra SS, Bhatnagar R. Biosensors for the detection of Mycobacterium tuberculosis: a comprehensive overview. Crit Rev Microbiol. 2022;48(6):784–812. doi:10.1080/1040841X.2022.2035314
21. Nieder C, Mehta MP, Geinitz H, Grosu AL. Prognostic and predictive factors in patients with brain metastases from solid tumors: a review of published nomograms. Crit Rev Oncol Hematol. 2018;126:13–18. doi:10.1016/j.critrevonc.2018.03.018
22. Wu L, Dai X, Wang H, et al. Prediction of the complication risk in drug-resistant tuberculosis after surgery: development and assessment of a novel nomogram. Front Surg. 2021;8:689742. doi:10.3389/fsurg.2021.689742
23. Liu P, Cai G, Gu H, Qin Y. Diagnostic nomogram to differentiate between epididymal tuberculosis and bacterial epididymitis. Infection. 2023;51(2):447–454. doi:10.1007/s15010-022-01916-6